Quantitative F₀ Analysis for the Cover Model
Moving beyond conceptual understanding, quantitative analysis of the cover model requires integrating measured stress-strain properties of vocal fold tissue with theoretical predictions of fundamental frequency. This section presents experimental data and predictions that validate the cover model for soft phonation and falsetto register.
Composite Graphical Analysis
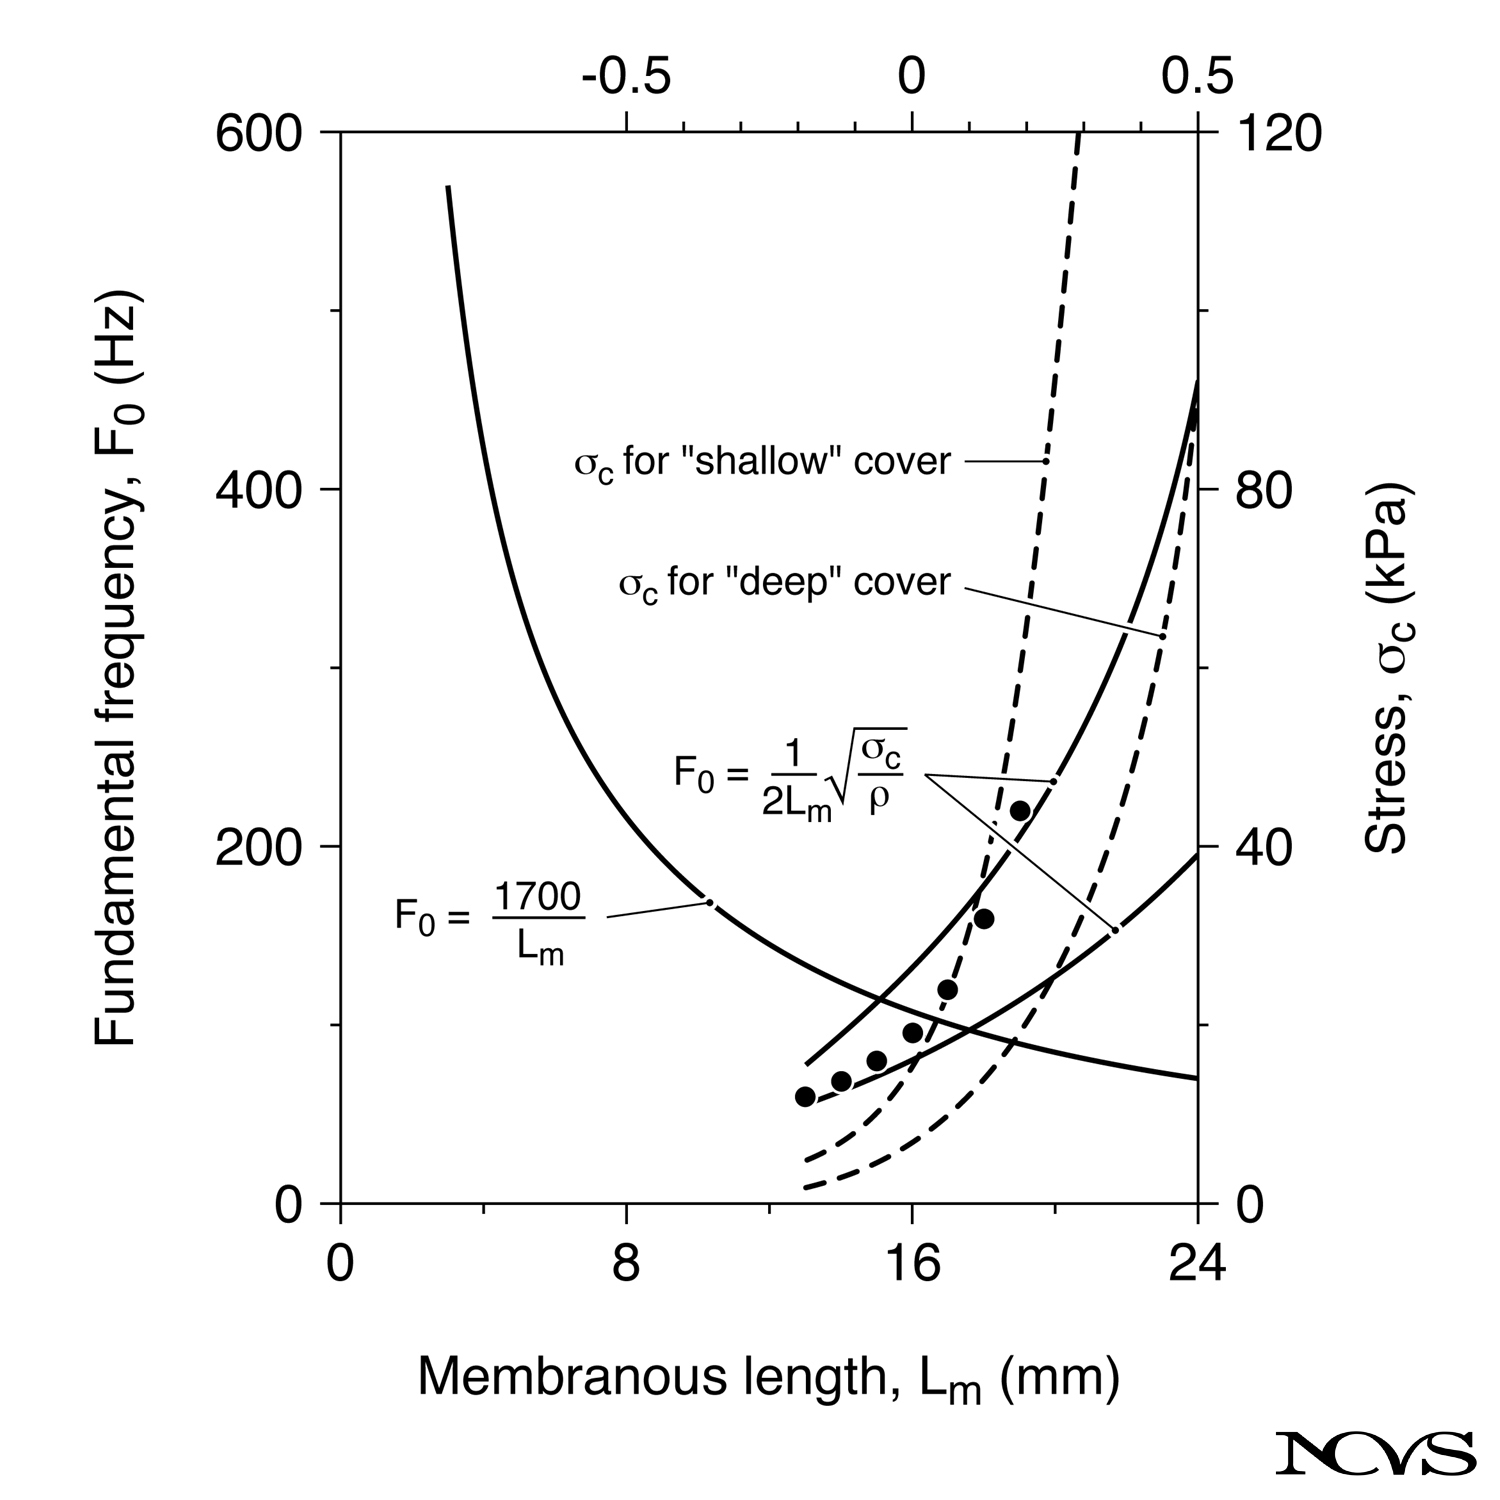 Figure 8.5: Stress-strain curves (dashed lines) for vocal fold cover tissues superimposed on F₀-Lm curves (solid lines).
The composite graph presents multiple relationships simultaneously:
Axes and Scales
- Bottom horizontal axis: Membranous length Lm (mm), ranging 0-24 mm
- Top horizontal axis: Strain ε (dimensionless), ranging -0.5 to +1.0
- Left vertical axis: Fundamental frequency F₀ (Hz), ranging 0-600 Hz
- Right vertical axis: Stress σc (kPa), ranging 0-120 kPa
Reference Conditions
- Zero strain corresponds to Lm = 16 mm
- This represents average cadaveric membranous length of large canine larynges
- Human membranous lengths typically range 10-17 mm
- Strain of +0.5 represents 50% elongation
The Constant-Stress Baseline
The curve labeled F₀ = 1,700/Lm provides an important reference:
Interpretation
- Represents F₀ if stress remained constant at all lengths
- Inverse relationship: F₀ decreases as Lm increases
- No stress variation with elongation
- Purely geometric effect
Mathematical Form
F₀ = C/Lm
where C is a constant determined by tissue density and stress level.
This curve is identical to that presented in Chapter 7 for average human speaking fundamental frequencies. If tissue stress were constant, F₀ would simply decrease inversely with length—shorter vocal folds would produce higher pitch purely due to geometry.
Measured Stress-Strain Curves
Two stress-strain curves (dashed lines) represent experimental measurements on excised canine vocal fold cover tissue at two different depths:
Deep Cover Configuration
Tissue Sample:
- Epithelium plus ~2 mm of superficial lamina propria
- Vertical thickness: ~4 mm
- Represents substantial cover involvement
- Typical of modal register at moderate pitch
Stress-Strain Behavior:
- Relatively low stress at short lengths (< 16 mm)
- Gradual stress increase with elongation
- Moderate nonlinearity
- Maximum stress ~40 kPa at 50% strain
Shallow Cover Configuration
Tissue Sample:
- Epithelium plus ~0.5 mm of superficial lamina propria
- Vertical thickness: ~4 mm
- Represents minimal cover involvement
- Typical of falsetto or very light voice
Stress-Strain Behavior:
- Very low stress at short lengths
- Dramatic stress increase above ~20% strain
- Highly nonlinear (epithelium dominates)
- Maximum stress ~120 kPa at 50% strain
- About 4× higher than deep cover at maximum elongation
Critical Observation
At short lengths (Lm < 16 mm, strain < 0):
- Deep and shallow curves nearly identical
- Epithelial stress negligible at low strain
- SLP provides primary restoring force
- Configuration difference has minimal effect
At long lengths (Lm > 20 mm, strain > 0.25):
- Shallow cover stress rises sharply (epithelium engages)
- Deep cover stress increases more gradually
- Stress ratio reaches ~4:1 at maximum elongation
- Configuration choice profoundly affects F₀
Predicted F₀-Length Curves
The solid curves show predicted F₀ from the string equation using measured stress:
F₀ = (1/2Lm) × √(σc/ρ)
Deep Cover Predictions
- Lower curve (solid line through “deep” region)
- F₀ increases from ~50 Hz to ~250 Hz
- Rise occurs despite increasing length
- Stress increase overcomes length increase
- Approximately 2.5 octaves range
Shallow Cover Predictions
- Upper curve (solid line through “shallow” region)
- F₀ increases from ~50 Hz to ~500 Hz
- Much steeper rise at high elongations
- Epithelial engagement drives rapid F₀ increase
- Approximately 3.3 octaves range
Physical Interpretation
The fact that both curves rise (F₀ increases with Lm) confirms:
- Stress-strain curves are sufficiently nonlinear
- √σc increases faster than Lm
- Cover model predicts pitch rise with elongation
- Nonlinearity requirement is satisfied
Experimental Validation
Data points (circles) represent measurements on excised canine larynges:
Experimental Methods
- Excised larynx mounted with controlled elongation
- Airflow provided at controlled pressure
- F₀ measured acoustically
- Multiple trials at different lengths
- Typical F₀ range: 50-220 Hz
Agreement with Predictions
At Low F₀ (50-100 Hz):
- Data points near “deep cover” curve
- Suggests substantial cover depth in vibration
- Consistent with lower pitch requiring larger amplitude
- Body may also participate slightly
At Intermediate F₀ (100-180 Hz):
- Data points between curves
- Effective depth decreasing with rising F₀
- Gradual transition from deep to shallow
- Natural optimization occurring
At High F₀ (180-220 Hz):
- Data points approach and exceed “shallow cover” curve
- Implies depth < 0.5 mm effective vibration
- Strong epithelial involvement
- Approaching pure falsetto configuration
Range Limitations
Maximum achieved F₀ (~220 Hz) is below human capability because:
- Canines lack well-developed vocal ligament
- Epithelium must bear all stress at high F₀
- Mucosal wave diminishes when epithelium tensed
- Phonation becomes difficult above this frequency
Depth of Vibration Regulation
A critical question emerges: How is effective depth actively regulated?
Passive Regulation
- Higher subglottal pressure increases amplitude
- Larger amplitude recruits deeper tissue
- Lower amplitude uses only superficial tissue
- Automatic adjustment with loudness
Active Regulation
- TA contraction may modulate depth
- Stiffening body makes it less likely to vibrate
- Differential stiffness between layers matters
- Voluntary control possible with training
Role of Vocal Ligament (Humans)
In humans, the vocal ligament provides additional control:
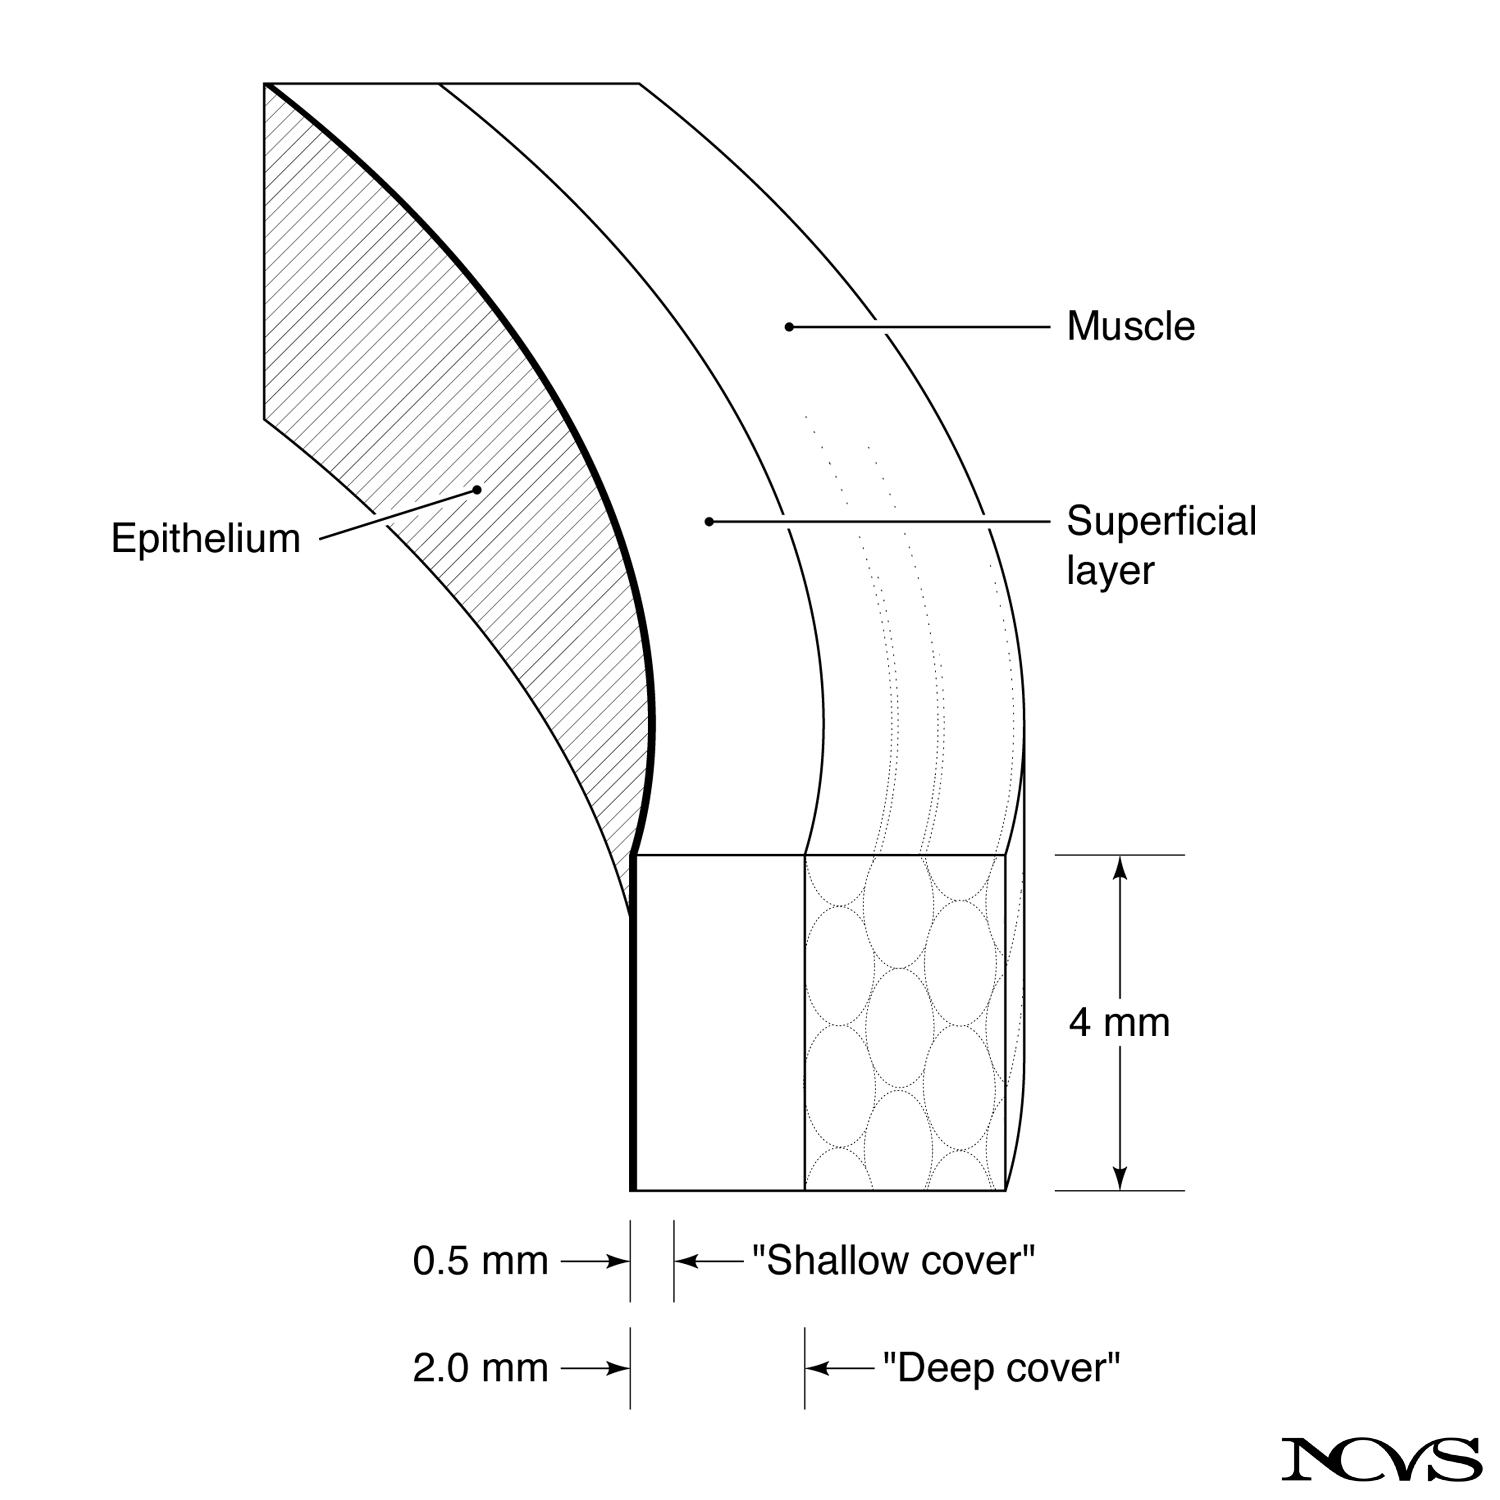 Figure 8.6: Schematic of tissue layers of human vocal folds.
Ligament Function:
- Can absorb most longitudinal stress
- Allows superficial layer to remain loose
- Epithelium not required to bear stress at high F₀
- Mucosal wave maintained even when highly tensed
Configuration Strategy:
- High F₀: Ligament tensed, mucosa loose
- Low F₀: Both ligament and mucosa loose, body may vibrate
- Moderate F₀: Mixed strategies possible
- Training optimizes layer recruitment
Stress Distribution Across Layers
The nonuniform stress distribution is crucial:
At Low Elongation
- All layers relatively loose
- Uniform low stress distribution
- Deep cover vibrates as unit
- SLP dominates mechanical behavior
At Moderate Elongation
- SLP beginning to tense
- Epithelium still relatively loose
- If ligament present, it begins bearing load
- Transition region
At High Elongation
- Epithelium (or ligament in humans) highly stressed
- SLP moderately stressed
- Strong stress gradient through depth
- Only superficial tissue loose enough for large amplitude
Quantitative Predictions
The 100:1 ratio in overall stress variation (highest to lowest on graph) produces approximately 10:1 ratio in F₀:
σc varies from ~1 kPa to ~100 kPa (100:1 ratio)
F₀ varies from ~50 Hz to ~500 Hz (10:1 ratio)
This confirms the square root relationship:
F₀ ratio = √(stress ratio) √100 = 10 ✓
Octave Analysis
- 50 Hz to 100 Hz: 1 octave (requires 4× stress increase)
- 100 Hz to 200 Hz: 1 octave (requires 4× stress increase)
- 200 Hz to 400 Hz: 1 octave (requires 4× stress increase)
- Total: ~3 octaves from 16× stress increase (actually 100×, so exceeds 3 octaves)
Implications for Human Phonation
Applying these principles to human voice:
Speaking Range
- Males: ~80-200 Hz (1.3 octaves)
- Requires ~5-6× stress variation
- Achievable with moderate elongation
- Body-cover interaction important
Singing Range (Modal)
- ~2 octaves typical
- Requires ~16× stress variation
- Substantial elongation needed
- Complex body-cover coordination
Singing Range (Including Falsetto)
- ~3-4 octaves for trained singers
- Requires ~64-256× stress variation
- Extreme configuration changes
- Vocal ligament essential for humans
Summary
Quantitative analysis using measured stress-strain curves from canine tissue demonstrates that the cover model successfully predicts F₀ increases with vocal fold elongation. The approximately 10:1 frequency range arising from 100:1 stress range confirms the square root relationship fundamental to oscillator physics. Experimental data from excised larynges show that effective depth of vibration decreases as F₀ increases, with behavior transitioning from “deep cover” at low pitch to “shallow cover” at high pitch.
The human vocal ligament provides a crucial advantage over the canine configuration, enabling high fundamental frequencies while maintaining a loose superficial layer for mucosal wave propagation. This anatomical specialization explains the extended pitch range characteristic of human speech and singing.
Key Takeaways
- ✅ Measured stress-strain curves predict F₀ increases with elongation for both deep and shallow cover
- ✅ Approximately 10:1 F₀ range results from 100:1 stress range (confirming square root relationship)
- ✅ Excised larynx data show effective depth decreases as F₀ increases
- ✅ At low F₀, data match “deep cover” predictions; at high F₀, they match “shallow cover”
- ✅ Epithelial stress dominates at high elongation for shallow cover configuration
- ✅ Canine larynges achieve maximum ~220 Hz due to lack of vocal ligament
- ✅ Human vocal ligament enables higher F₀ while maintaining mucosal wave
- ✅ Active and passive mechanisms regulate effective depth of vibration
Related Topics
- Analogies with Vibrating Strings and Ribbons
- Mechanics of Vocal Fold Elongation
- The Body-Cover Model of F₀ Control
Further Reading
- Perlman, A. L., & Durham, P. L. (1987). Mechanical properties of canine vocal fold tissue. Journal of the Acoustical Society of America, 81, S34.
- Durham, P. L., Titze, I. R., & Scherer, R. C. (1987). Measurement of mucosal wave on the vocal folds. Journal of the Acoustical Society of America, 81, S34.
- Hirano, M. (1975). Phonosurgery: Basic and clinical investigations. Otologia (Fukuoka), 21, 239-442.