Involuntary Register Transitions: Two Hypotheses
A major unresolved issue in the study of registers is the consistency with which involuntary register changes occur at specific fundamental frequencies. Vocalists and listeners can often detect quantal changes in the voice when a scale or glissando is sung and no quality changes are intended. Understanding why these transitions occur at particular pitches has important implications for both voice pedagogy and vocal health.
The Central Question
What causes register changes and why do they occur at specific fundamental frequencies? For example, why is a major involuntary transition found so consistently in the region of 300 Hz to 350 Hz for both males and females?
This region is called the primo passaggio (“first passage”) for females and the secondo passaggio (“second passage”) for males. The two passages seem to reflect the same phenomenon—a breaking into or out of the modal register. In musical notation, the break tends to occur between D₄ (294 Hz) and F₄ (349 Hz).
Pedagogical Observations
The tradition of identifying specific register transitions goes back many years in vocal pedagogy. Figure 10.8 shows pedagogical investigations of F₀ ranges for six voice categories, ranging from bass to soprano:
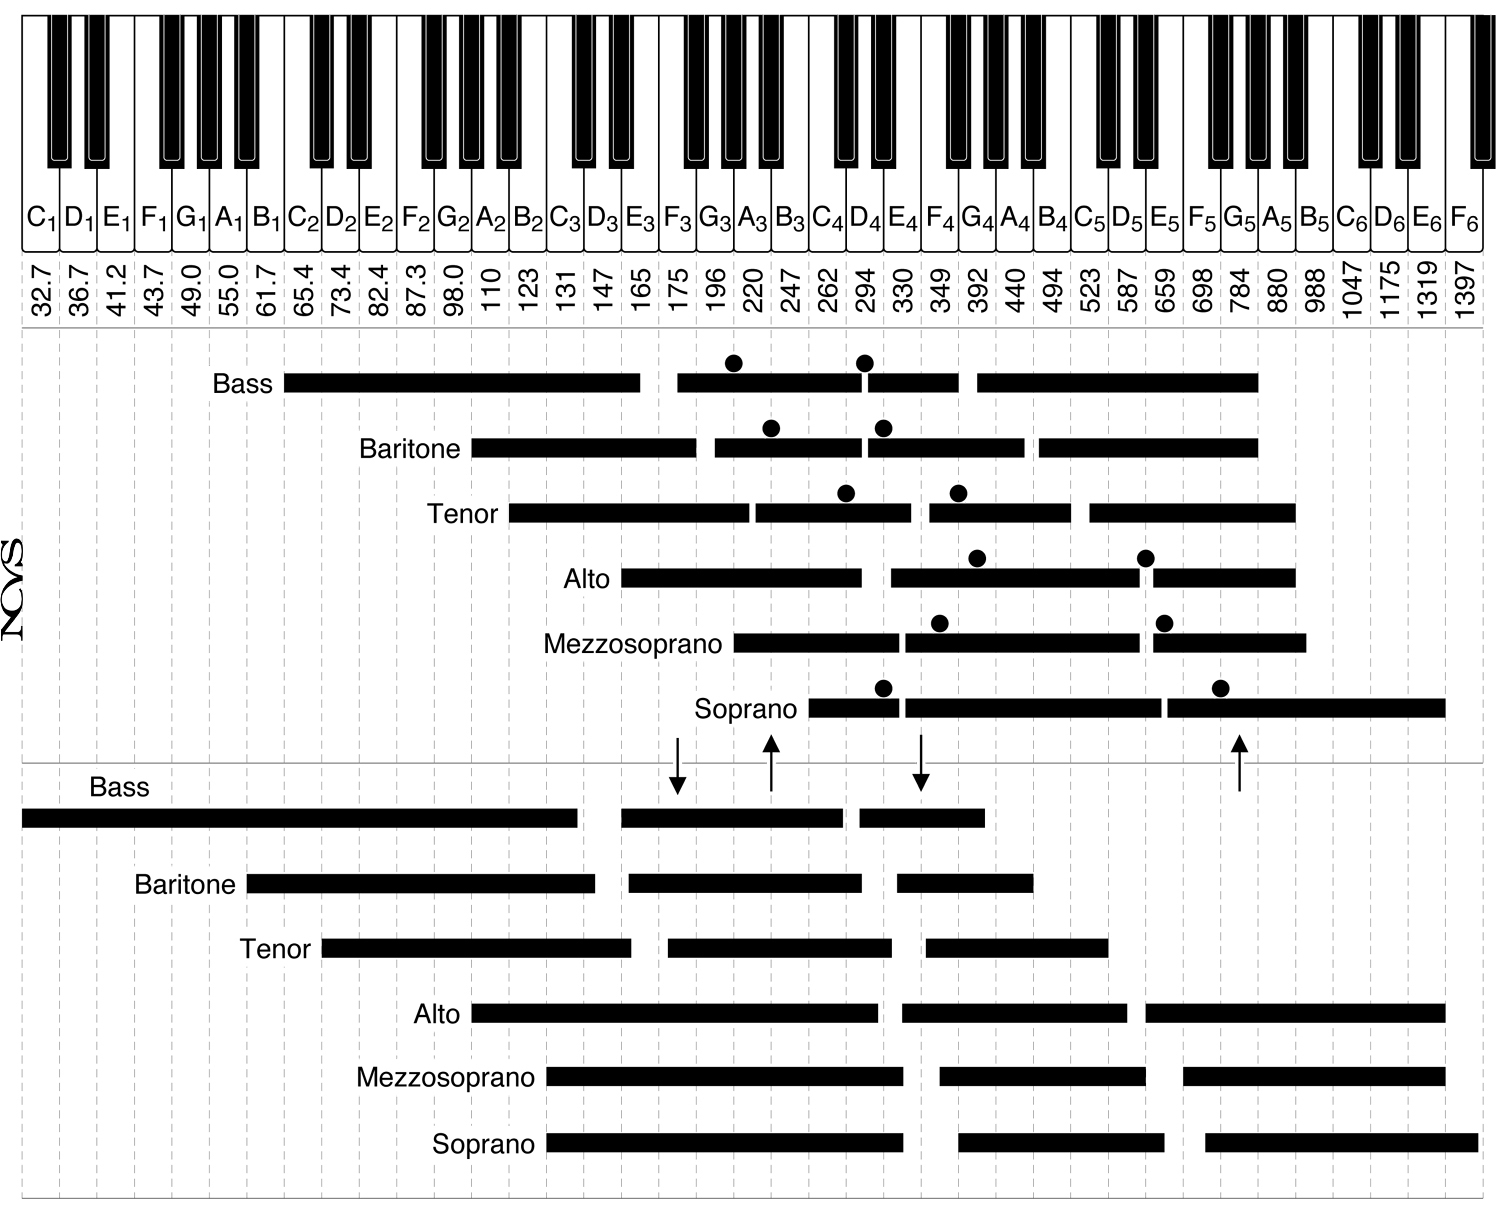 Figure 10.8: Vocal registers as classified by Tarneaud (1961) for the singing voice (above) and by Nadoleczny (1923) and Preissler (1939) for the physiological vocal range (below). Dots refer to register shifts as identified by Miller (1986), and arrows refer to transitions as predicted by the hypotheses discussed in this chapter.
For each voice classification, the bars are interrupted in two or three places to indicate where a register change is alleged to occur involuntarily. In traditional Italian musical terminology, these involuntary register changes are called passaggi (“passages,” from one register to another).
Characteristics of Involuntary Transitions
The transition can be smoothed out by training, as is done in classical styles of singing, or it can be accentuated, as in yodeling and some country-western styles. The ability to either smooth or exaggerate these transitions suggests they have a definite physiological or acoustic basis.
Hypothesis One: Subglottal Resonances
Some discussion of the effects of subglottal resonances on the vibration pattern of the vocal folds was offered by Van den Berg (1960) and more recently by Titze (1983, 1988) and Austin (1992). The fundamental concept is that acoustic pressures below the vocal folds can be phased in such a way that they contribute, constructively or destructively, to the intraglottal driving pressures of the vocal folds.
The Resonance Phenomenon
Van den Berg appeared to have confirmation of this hypothesis on the basis of his 300-Hz measurement on cadavers of the first subglottal formant frequency. However, later measurements on live subjects have established a 500-Hz-to-600-Hz range for this frequency. Based on the more recent 510-Hz measurement reported by Cranen and Boves (1987), involuntary register changes may be linked to resonance phenomena in the trachea.
Phase Relationships
Figure 10.9 shows several cases of constructive and destructive interference between subglottal formant pressure and vocal fold movement:
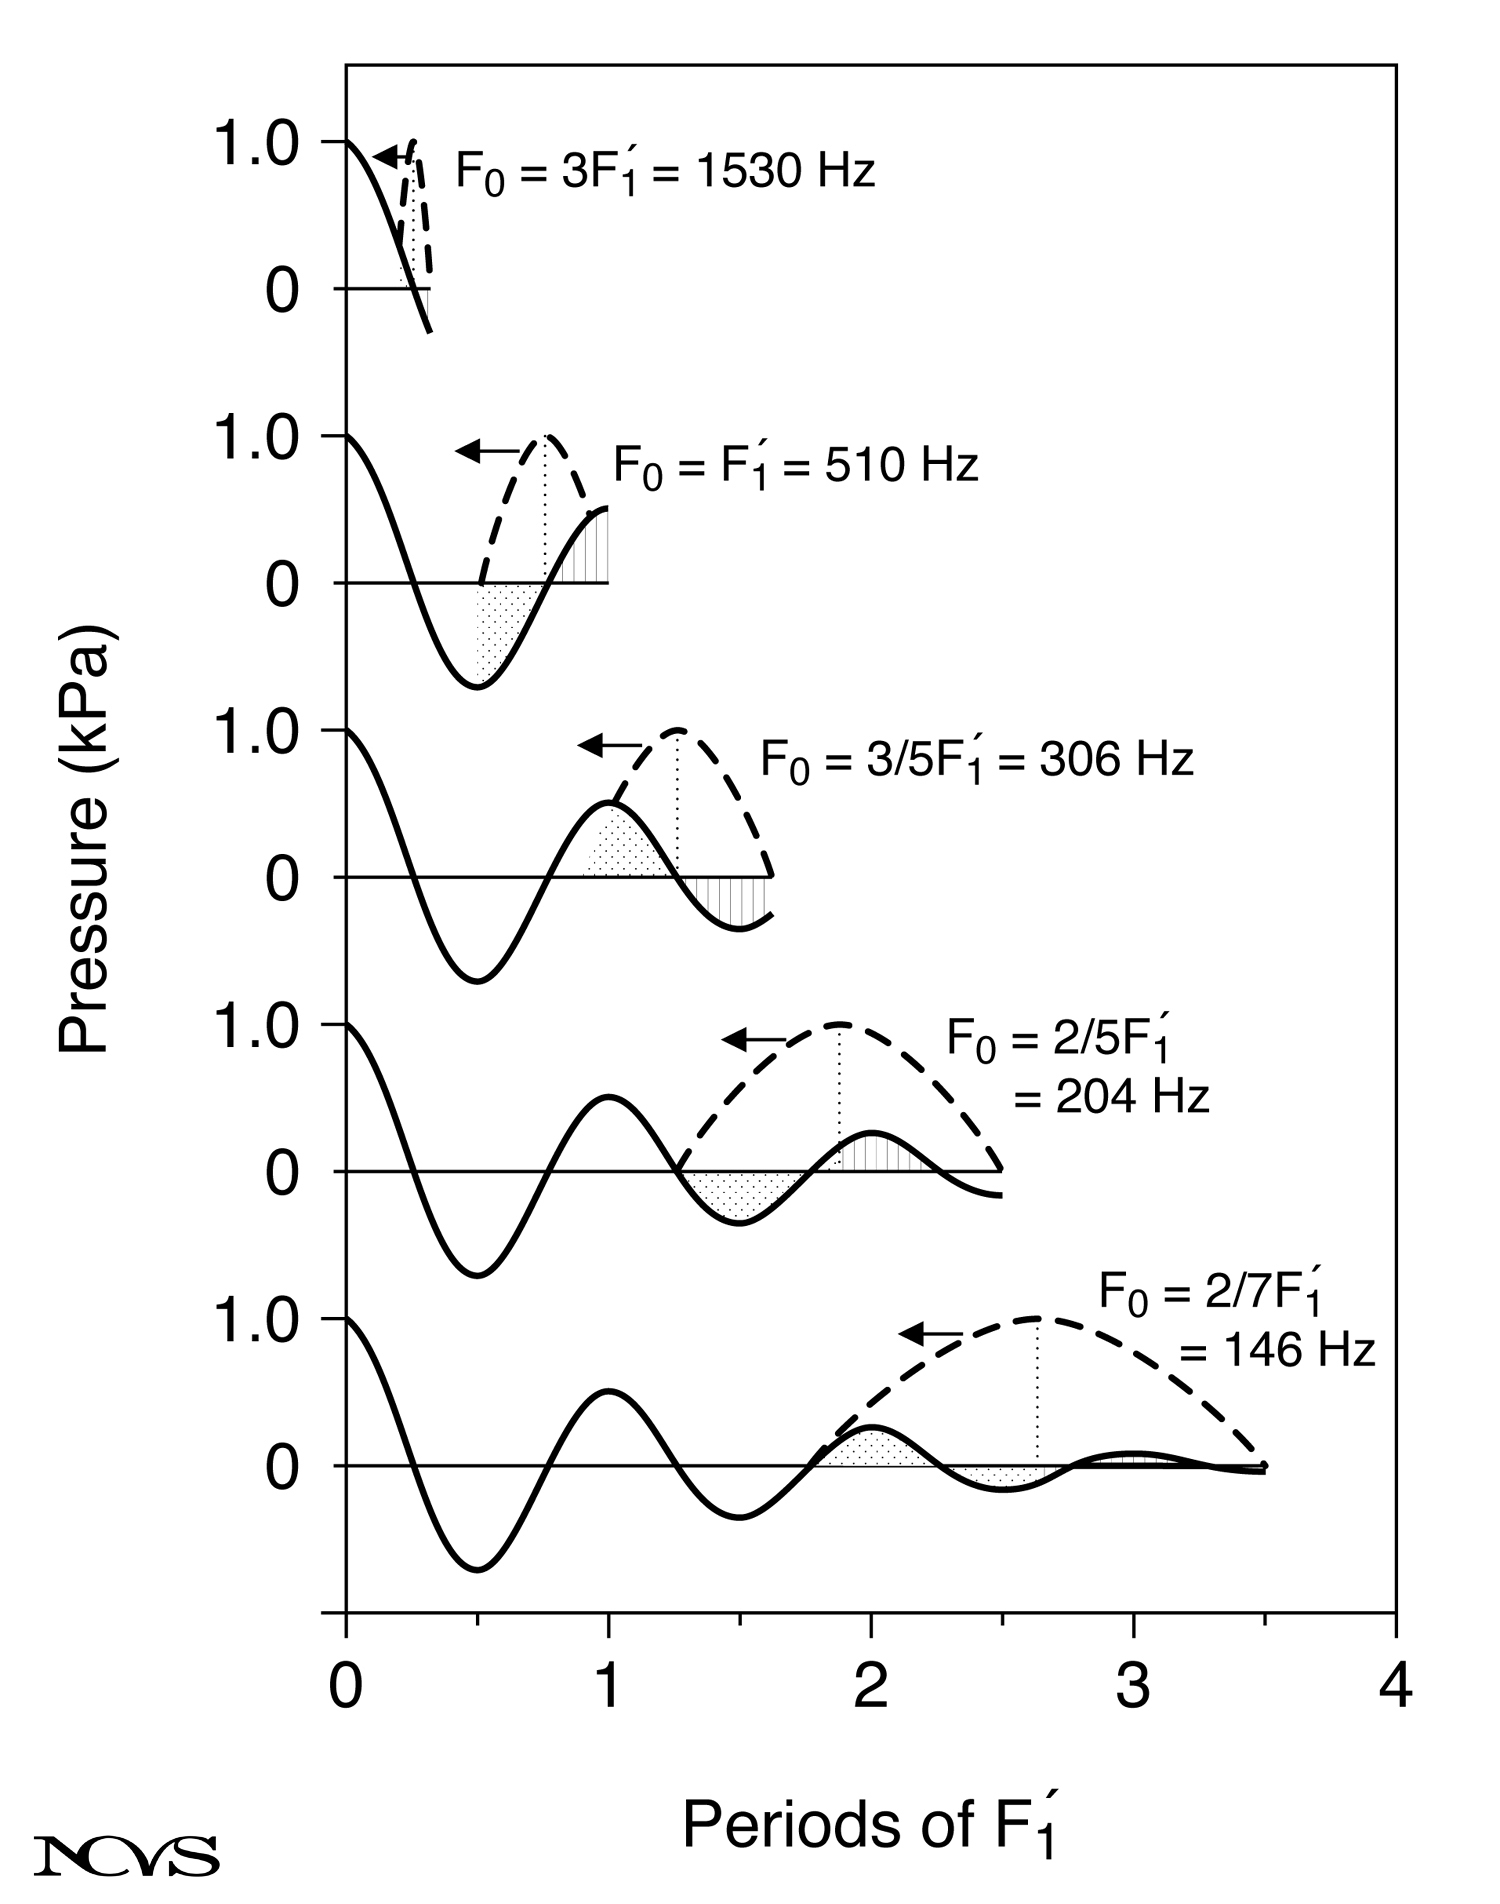 Figure 10.9: Phase relationships between the pressure waveform of the first subglottal formant F₁’ (solid lines) and the glottal area waveform (dashed lines) for systematically increasing fundamental frequency F₀ (bottom to top).
In all cases, excitation and decay of the first subglottal formant F₁’ is shown with solid lines. Superimposed (in dashed lines) is one period of the glottal area (open phase) for five different values of F₀ that correspond to specific fractions of F₁’. The range is from F₀ = (2/7)F₁’ at the bottom to F₀ = 3F₁’ at the top.
Constructive and Destructive Interference
Positive reinforcement of vocal fold vibration is achieved when the formant pressure is positive during opening and negative during closing. When the bottom portions of vocal folds are moving outward, a positive pressure helps to push them outward. When the same portions are moving inward, a negative pressure helps to suck them inward.
The analysis reveals alternate conditions of constructive and destructive interference:
- F₀ = (3/5)F₁’ (306 Hz): Positive pressure during entire outward movement, negative pressure during inward movement—favorable
- F₀ = F₁’ (510 Hz): Negative pressure during opening, positive pressure during closing—unfavorable
- F₀ = (2/7)F₁’ (146 Hz): Another favorable condition
- F₀ = (2/5)F₁’ (204 Hz): Another unfavorable condition
- F₀ = 3F₁’ (1,530 Hz): Favorable condition at high frequencies
Predicted Amplitude Changes
The entire response curve of ΔA (change in amplitude) as a function of F₀ is shown in Figure 10.10:
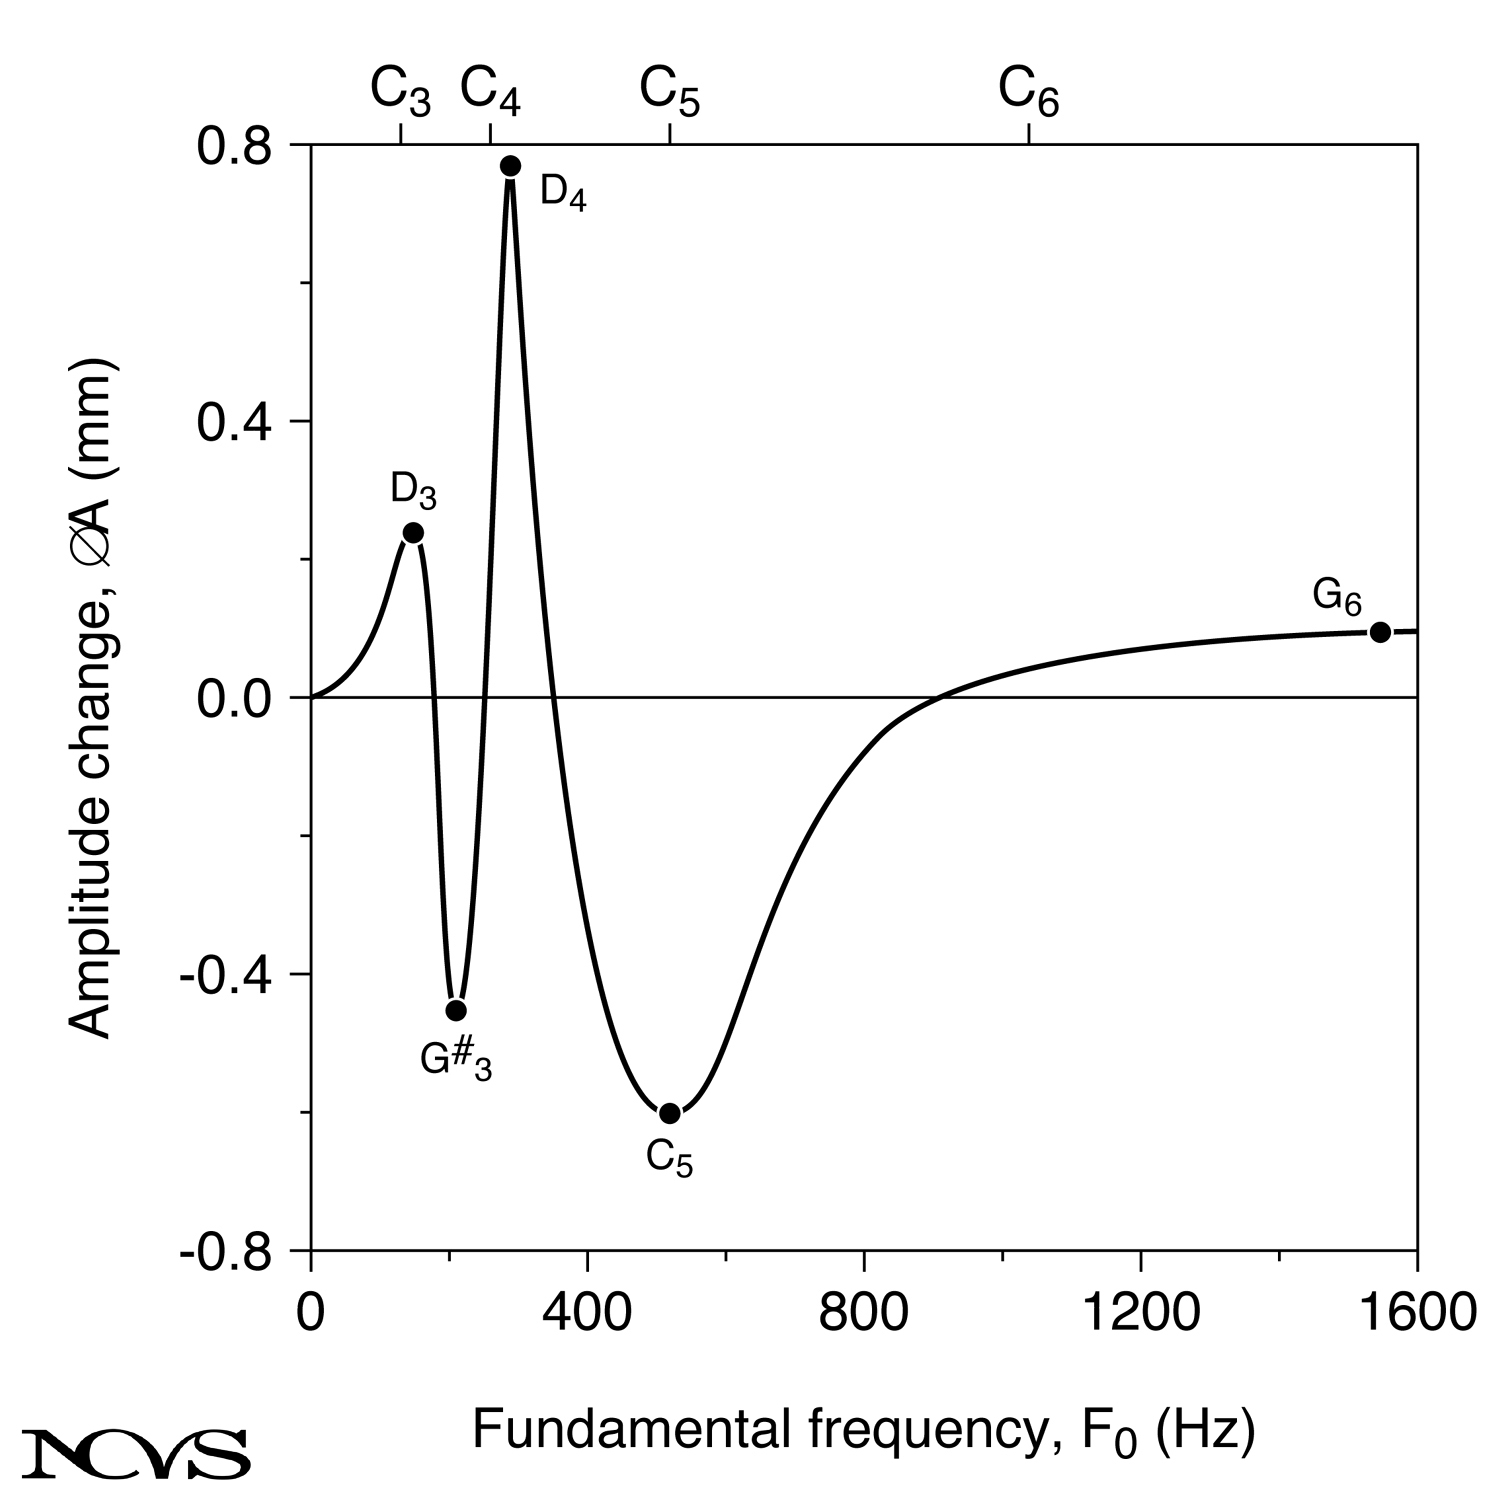 Figure 10.10: Predicted change in vibrational amplitude as a function of fundamental frequency due to subglottal pressure variations in the vocal fold driving pressure.
Three peaks and two valleys correspond to the cases shown in Figure 10.9:
Peaks (increased amplitude):
- 146 Hz (approximately D₃)
- 306 Hz (approximately D₄)
- 1,530 Hz (approximately G₆)
Valleys (decreased amplitude):
- 204 Hz (approximately G#₃)
- 510 Hz (approximately C₅)
Relationship to Abduction Quotient
If the prephonatory glottal half width ξ₀ is kept constant (no change in arytenoid spacing), the abduction quotient Qa = ξ₀/A decreases at the peaks and the voice changes toward richer timbre (modal register). The notes around D₃ and D₄ should therefore be optimally suited for modal register production.
Conversely, the notes around 200 Hz (G#₃) and those around 500 Hz (C₅) should be least suitable for modal production. Singers are well aware of this, often having much difficulty producing chest voice (modal register) between A₄ and C₅.
Variability Across Voice Types
It is conceivable that all of the involuntary register transitions (passaggi) can be accounted for by the first subglottal resonance. Considering an approximate 10 percent to 20 percent difference in tracheal length between basses and sopranos, the peaks and valleys will all have a spread of this percentage. In musical terms, the spread would correspond to two or three semitones, which agrees roughly with the observed spread in register transitions for different voice categories.
Hypothesis Two: Maximum Active Thyroarytenoid Stress
Some phenomena related to registers are not explained by the subglottal resonance hypothesis. For example:
- The fact that involuntary transitions from modal register to falsetto register are often accompanied by large upward jumps in fundamental frequency is not explained
- The apparent need by a vocalist to deactivate the thyroarytenoid muscle for high fundamental frequencies (Hirano, Vennard, & Ohala, 1970) is not explained
The Physiologic Limit Concept
A second hypothesis proposes that a physiologic limit in the maximum active stress in the thyroarytenoid (TA) muscle may trigger a transition from modal register to falsetto register.
The Muscle Activation Plot
Figure 10.11 shows the muscle activation plot (MAP), a redrawn version of the figure from Chapter 8:
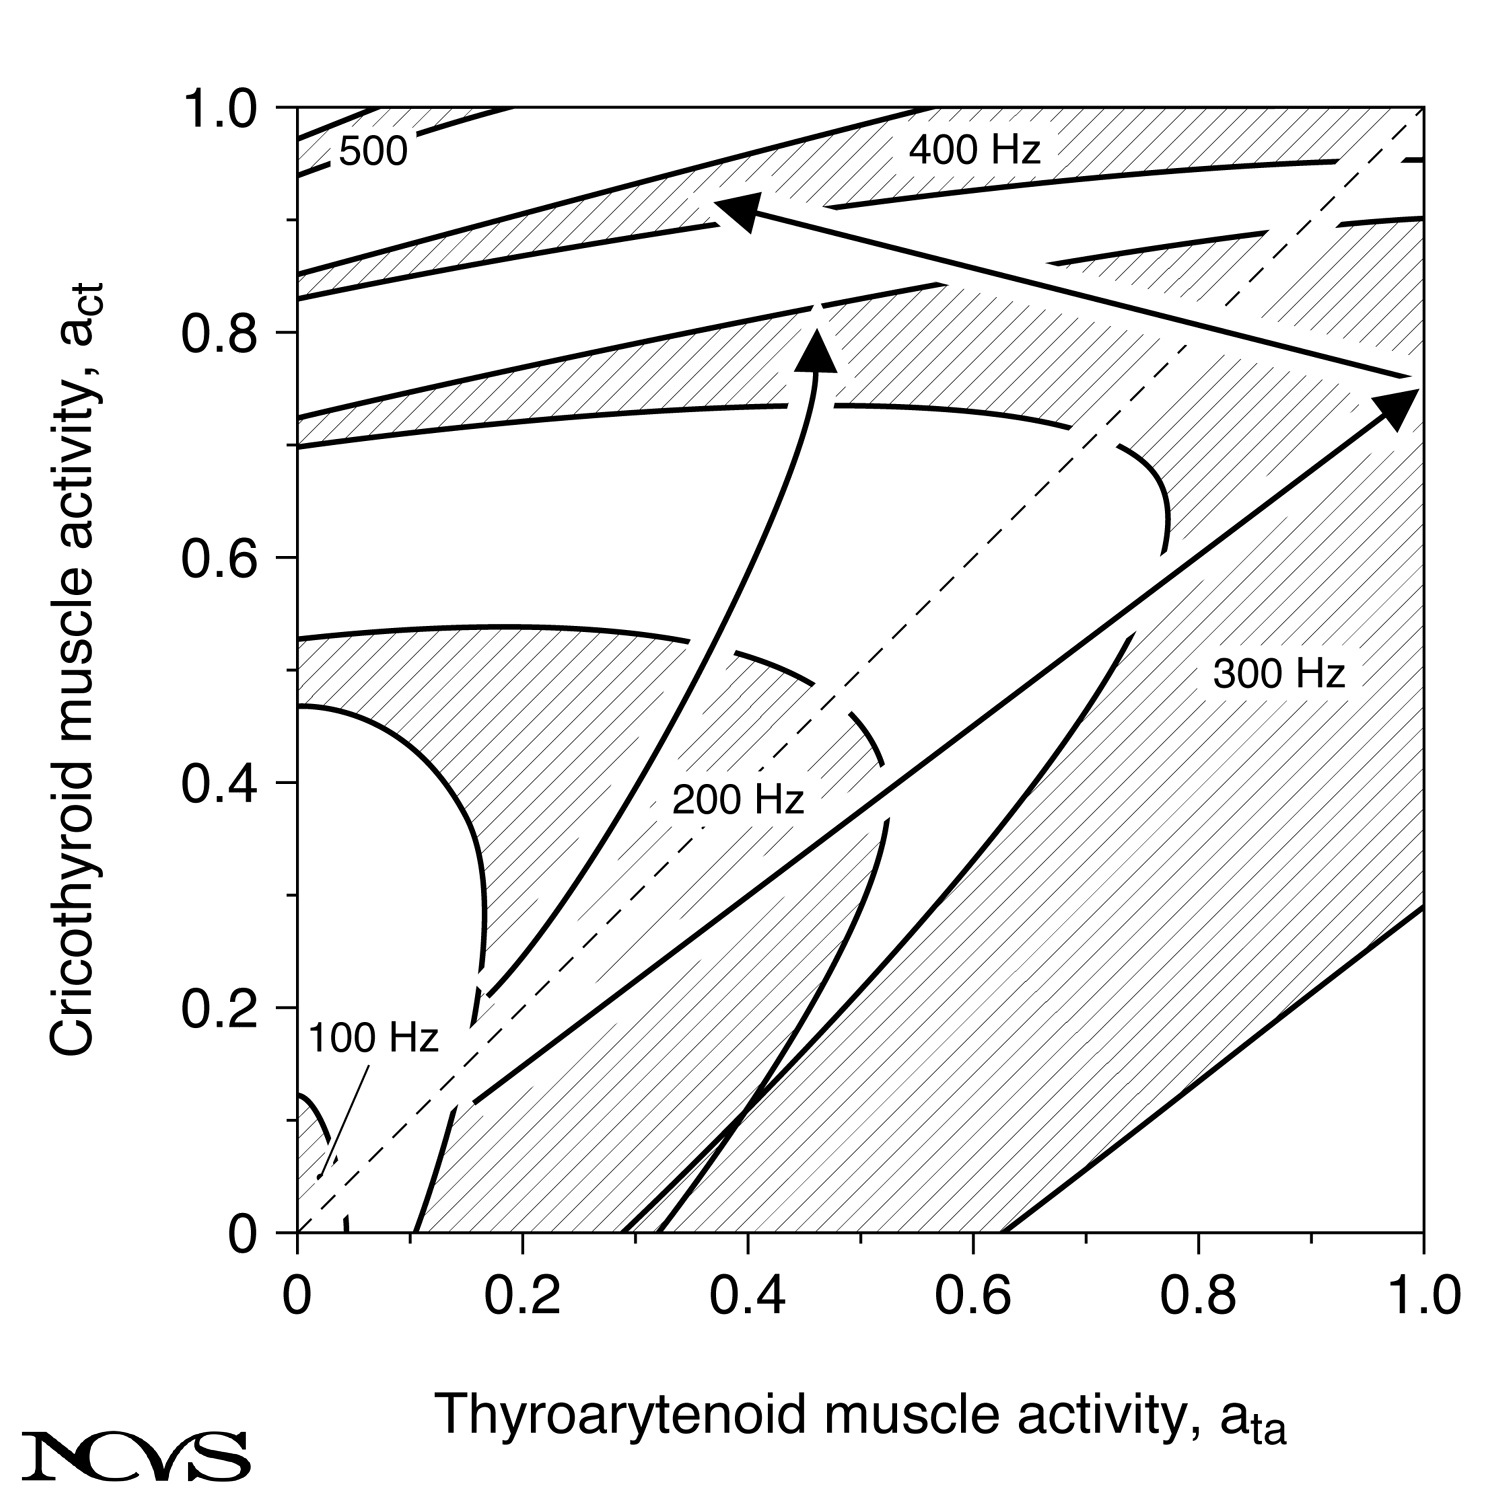 Figure 10.11: Muscle activation plot (MAP) showing abrupt register transition (two straight arrows) and gradual transition (curved arrow).
The constant frequency bands tend to be vertical in the lower half of the MAP and horizontal in the upper half, with a bend in the middle. Two paths are indicated:
Path 1: Below the Diagonal (Abrupt Transition)
In the lowest path, activity in the TA muscle (aTA) is greater than activity in the CT muscle (aCT). Lower F₀ bands (100 Hz to 300 Hz) are attainable. When aTA reaches 1.0 (100 percent contraction), however, no more F₀ increase can be realized in this direction.
Higher frequencies can be achieved by releasing aTA (see the arrow pointing toward the left). This involves a register transition, which is perceived as a break when executed abruptly, as in a yodel. The TA muscle is disengaged too suddenly, with the vocal ligament becoming the instantaneous absorber of the longitudinal tension applied by the CT muscle.
Path 2: Above the Diagonal (Smooth Transition)
A different approach, followed by many skilled vocalists, is to gradually release aTA at lower values of F₀. The path above the diagonal depicts this approach. An abrupt change in muscle activity is then not necessary, but significant training is required to disengage the TA muscle gradually while engaging more of the CT.
The resulting transition, if smooth enough, is not perceived by listeners as a register break. This differential control of two intrinsic laryngeal muscles is one of the most difficult tasks in all of voice training.
Quantitative Prediction
If the hypothesis about maximum TA activity is to be useful for a quantitative prediction of a register break, a maximum observed F₀ value in the modal register should correspond to a maximum active stress value in the TA muscle.
Assuming the maximum TA contraction yields a longitudinal stress of about 100 kPa in canine muscle fibers (from Chapter 2), and assuming stringlike vibration of the fibers, F₀ is predicted to be:
F₀ = (1/2L)√(σmax/ρ)
   = (1/[2×0.01])√(100,000/1040)
   ≈ 500 Hz
Where:
- L = membranous vocal fold length (about 0.01 m)
- ρ = tissue density (1,040 kg/m³)
- σmax = maximum stress (100 kPa)
Male and female belters are indeed able to push the modal (chest) register up to this frequency (about C₅). Even some classically trained tenors can push their chest voice to high C (hence the Italian phrase do di petto, or “C in chest”).
Uncertainty in Application
It is unclear whether the maximum TA stress hypothesis applies directly to one of the register transitions outlined in Figure 10.8. If it were to explain the transition around F₄:
- The human TA muscle would, on the average, produce only about half the maximum active stress that the canine TA muscle can produce in vitro
- This is possible because in vitro maximum stress (with artificial stimulation) is likely greater than in vivo maximum active stress (with asynchronous fiber activation)
The maximum stress hypothesis would explain why the F₄ transition is nearly the same for males as for females, assuming that maximum muscle stress is not gender-specific.
Reconciling the Two Hypotheses
Both hypotheses likely contribute to the phenomenon of involuntary register transitions, but at different frequency regions and under different conditions:
Subglottal Resonance Hypothesis Strengths
- Explains multiple transition points across the vocal range
- Accounts for variability across voice types based on tracheal length differences
- Predicts specific frequencies that match pedagogical observations
- Explains why certain pitches are naturally more stable in certain registers
Maximum TA Stress Hypothesis Strengths
- Explains the need to disengage TA muscle at high frequencies
- Accounts for the upward pitch jump often accompanying register breaks
- Explains the upper limit of modal/chest register
- Provides a physiological mechanism for the most prominent transition
Integration
The two hypotheses are not mutually exclusive. The subglottal resonance hypothesis may explain the location of natural transition points, while the maximum TA stress hypothesis may explain the mechanism by which the transition occurs, particularly at the upper end of the modal register.
Summary
Two primary hypotheses attempt to explain why involuntary register transitions occur at specific fundamental frequencies. The subglottal resonance hypothesis proposes that tracheal resonances create peaks and valleys in vocal fold vibrational amplitude at predictable frequency ratios, with transitions occurring at approximately 146 Hz, 204 Hz, 306 Hz, and 510 Hz. The maximum TA stress hypothesis suggests that physiological limits in thyroarytenoid muscle activation force transitions around 350-500 Hz when the muscle can no longer provide sufficient tension for modal register production. Both hypotheses offer testable predictions and likely contribute to the complex phenomenon of register transitions, with the subglottal resonance explaining multiple transition points throughout the range and the TA stress hypothesis explaining the mechanism of the primary modal-falsetto transition.
Key Takeaways
- ✅ Involuntary register transitions occur consistently at specific fundamental frequencies across different voice types
- ✅ The primo/secondo passaggio at 300-350 Hz represents the most prominent transition for both males and females
- ✅ The subglottal resonance hypothesis predicts transitions at specific frequency ratios relative to the first subglottal formant (approximately 510 Hz)
- ✅ Constructive interference occurs at F₀ = (2/7)F₁’, (3/5)F₁’, and 3F₁’, corresponding to approximately 146 Hz, 306 Hz, and 1,530 Hz
- ✅ Destructive interference occurs at F₀ = (2/5)F₁’ and F₁’, corresponding to approximately 204 Hz and 510 Hz
- ✅ The maximum TA stress hypothesis proposes that physiological limits in muscle activation force transitions around 500 Hz
- ✅ Skilled vocalists can smooth transitions by gradually releasing TA activity while increasing CT activity
- ✅ The two hypotheses are complementary, potentially explaining different aspects of the same phenomenon
Related Topics
- Hypothesis One: Subglottal Resonances
- Hypothesis Two: Maximum Active Thyroarytenoid Stress
- Perception of Vocal Registers
- Clinical and Pedagogical Issues
- Fundamental Frequency Control
- Laryngeal Muscles
Further Reading
- Titze, I. R. (1988). A framework for the study of vocal registers. Journal of Voice, 2(3), 183-194.
- Hirano, M., Vennard, W., & Ohala, J. (1970). Regulation of register, pitch, and intensity of voice. Folia Phoniatrica, 22, 1-20.
- Cranen, B., & Boves, L. (1987). On subglottal formant analysis. Journal of the Acoustical Society of America, 81(3), 734-746.
- Van den Berg, J. W. (1960). An electrical analogue of the trachea, lungs, and tissues. Acta Physiologica Pharmacologica Neerlandica, 9, 1-24.
- Miller, R. (1986). The structure of singing. New York: Schirmer.
- Austin, S. (1992). Subglottal resonance and voice registers. Unpublished thesis, University of Iowa, Iowa City.