Periodicity and Modulation
The distinction between perfectly periodic signals and real voice signals forms a critical foundation for understanding voice analysis methods and their limitations. While theoretical models often assume perfect periodicity—each cycle identical to the last—biological voice production generates quasi-periodic signals with systematic modulations superimposed on random perturbations. Understanding these modulations, their measurement, and their perceptual consequences proves essential for both scientific investigation and clinical application.
Perfect versus Quasi-Periodic Signals
A perfectly periodic signal repeats identically with constant period T. Mathematically, such a signal satisfies:
x(t) = x(t + T) for all tThis perfect periodicity implies a harmonic spectrum containing energy only at integer multiples of the fundamental frequency, with zero energy between harmonics. Real musical instruments approach this ideal during sustained notes, though even the most stable oscillators exhibit some variation.
Quasi-periodic signals approximate periodicity but violate the strict mathematical definition. Each cycle resembles its neighbors without being identical. The period fluctuates slightly, amplitudes vary, and waveform shapes change subtly from cycle to cycle. These variations create spectral sidebands around harmonics and introduce broadband noise components.
Voice signals occupy a continuum from nearly periodic (healthy sustained vowels) to severely aperiodic (rough dysphonic voices, vocal fry, diplophonia). This continuum challenges analysis methods designed for perfectly periodic signals and requires careful consideration of signal characteristics before applying specific measurement techniques.
Implications for Analysis
The quasi-periodic nature of voice signals affects virtually every analysis method. Pitch tracking algorithms must tolerate period variation while avoiding “octave errors” where two cycles are mistaken for one. Spectral analysis must account for harmonic peak broadening due to period fluctuations. Perturbation measures inherently quantify the deviation from perfect periodicity, with validity dependent on that deviation remaining small relative to the mean values.
Fundamental Frequency Modulation
Fundamental frequency modulation (F₀ modulation or FM) describes systematic variation in the period of oscillation. Unlike random jitter, FM involves slower, often more regular changes spanning multiple cycles. The modulation rate, depth, and regularity determine both perceptual quality and appropriate analysis methods.
Characterizing FM
FM is characterized by several parameters:
Modulation Rate: The frequency at which F₀ varies, typically expressed in Hz. Vibrato exhibits rates around 5-7 Hz. Tremor typically ranges from 4-8 Hz. Very slow drift (< 0.5 Hz) may reflect respiratory patterns or declining subglottal pressure.
Modulation Depth or Extent: The magnitude of F₀ variation, expressed in Hz, semitones, or cents. Vibrato depth typically spans ±50 cents (±3% of center frequency, or approximately ±1 semitone total range). Pathological tremor may show greater depth exceeding 100 cents.
Regularity: The consistency of modulation rate and depth. Vibrato shows high regularity with stable rate and depth. Pathological tremor exhibits more variable characteristics. Random perturbations show no regularity, representing the limit of irregular “modulation.”
Spectral Consequences
FM creates spectral sidebands around each harmonic. For sinusoidal modulation at frequency fm applied to a harmonic at frequency fh, sidebands appear at fh ± fm, fh ± 2fm, fh ± 3fm, and so forth. The amplitudes of these sidebands depend on the modulation depth according to Bessel functions.
For typical vibrato with 6-Hz rate and moderate depth, sidebands remain close to the main harmonic peaks and may not be perceptually resolved as separate frequencies. Instead, they contribute to a sense of spectral richness and fluctuating tonal quality. With greater modulation depth or for listeners with high frequency resolution, sidebands may become separately perceptible, potentially creating roughness or “beating” sensations.
Amplitude Modulation
Amplitude modulation (AM) describes systematic variation in the strength of the signal over time. Like FM, AM may be regular (vibrato, tremor) or irregular (perturbations, noise).
AM Characteristics
AM is similarly characterized by modulation rate, depth, and regularity:
Rate: Often correlates with FM rate. In vibrato, AM and FM typically occur at similar frequencies, often with specific phase relationships. Tremor may show AM independent of or correlated with FM depending on the neural control mechanisms involved.
Depth: Expressed as percentage variation around mean amplitude or in decibels. Vibrato AM depth typically ranges from 10-30% (1-3 dB). Greater depths create more pronounced intensity fluctuation potentially perceived as unsteadiness.
Waveform: The shape of amplitude variation over time—sinusoidal, triangular, irregular. Regular modulations tend toward sinusoidal waveforms. Pathological conditions may produce irregular or asymmetric AM patterns.
Spectral Effects
AM creates sidebands similar to FM, though the physical interpretation differs. For AM, sidebands arise from multiplicative interaction between the carrier signal (voice harmonics) and the modulating envelope, rather than from frequency deviation. The resulting spectral pattern resembles that of FM, with sidebands surrounding each harmonic.
Phase Relationships Between FM and AM
In many instances of voice modulation, FM and AM occur simultaneously but not independently. The phase relationship between FM and AM—whether amplitude peaks coincide with frequency peaks, troughs, or intermediate points—affects both the acoustic spectrum and perceptual quality.
Vibrato Phase Relationships
Research on singing vibrato indicates that F₀ and intensity typically oscillate in phase or near-phase: when fundamental frequency reaches its maximum, intensity also peaks. This phase relationship arises from the biomechanical and aerodynamic mechanisms producing vibrato. Increased longitudinal tension that raises F₀ typically coincides with increased glottal closure that boosts acoustic intensity.
This in-phase relationship creates specific spectral characteristics distinguishing vibrato from simple FM or AM applied independently. The combined effect enhances spectral sidebands asymmetrically, with greater energy above the main harmonic peaks when F₀ and intensity rise together.
Tremor Phase Patterns
Pathological tremor may show different phase relationships depending on whether laryngeal, respiratory, or combined mechanisms dominate. Purely laryngeal tremor driven by oscillating muscle tension produces FM with associated AM due to tension-closure relationships. Respiratory tremor from pulsating subglottal pressure creates AM with less pronounced FM. Mixed mechanisms produce complex phase patterns requiring detailed analysis to characterize.
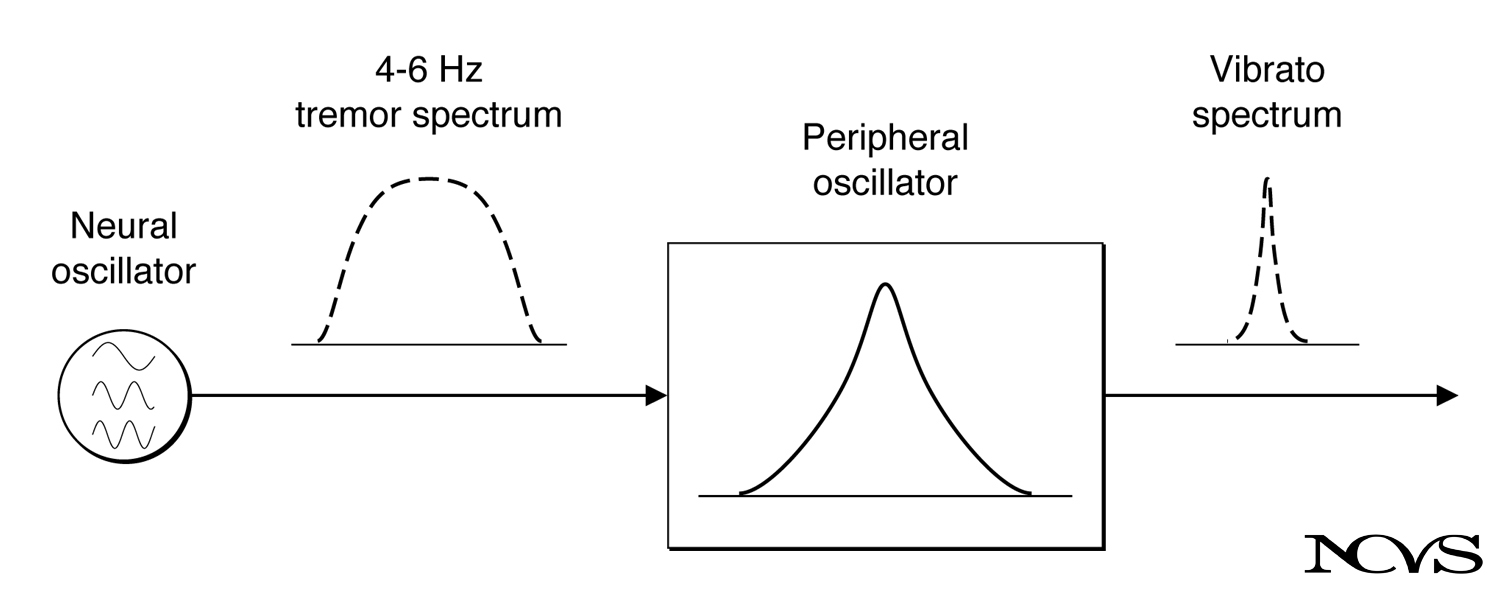 Figure 11.7: Examples of fundamental frequency modulation (FM) and amplitude modulation (AM) in voice signals, showing both in-phase and out-of-phase relationships.
Harmonics-to-Noise Ratio
The harmonics-to-noise ratio (HNR) quantifies the relative energy in periodic (harmonic) versus aperiodic (noise) components of the voice signal. Unlike jitter and shimmer which measure cycle-to-cycle variations, HNR characterizes the overall signal composition.
Measurement Approaches
Several algorithms compute HNR:
Cepstral Method: Applies inverse Fourier transform to the log spectrum, separating periodic (low-quefrency) from aperiodic (high-quefrency) components based on the cepstral peak structure.
Autocorrelation Method: Compares the autocorrelation function maximum (at lag equal to the fundamental period) to the autocorrelation at zero lag. High peak-to-zero ratios indicate strong periodicity and high HNR.
Harmonic Sieve Method: Estimates harmonic component energy by summing power within narrow bands around harmonic frequencies, with remaining energy attributed to noise.
Methods may yield different numerical values while generally agreeing on relative HNR rankings across voices or conditions.
Clinical Interpretation
HNR typically ranges from 5 to 25 dB in voice signals:
Normal voices: 15-25 dB HNR, indicating dominant harmonic energy with relatively little noise Mildly dysphonic: 10-15 dB HNR, showing increased noise but preserved harmonic structure Moderately dysphonic: 5-10 dB HNR, with substantial noise masking harmonics Severely dysphonic: <5 dB HNR, approaching aphonic production with minimal periodicity
HNR correlates with perceived breathiness, roughness, and overall dysphonia severity. Unlike jitter and shimmer which fail for severely irregular voices, HNR remains calculable across a wide range of voice qualities, making it useful for characterizing voices too aperiodic for conventional perturbation analysis.
Signal Stationarity Assumptions
Most voice analysis methods assume stationarity—that statistical properties remain constant over the analysis window. This assumption enables applying time-averaging techniques, spectral analysis, and perturbation measurements. Real voice signals, however, are at best approximately stationary.
Types of Nonstationarity
Drift: Slow systematic changes in mean values. Fundamental frequency may decline as lung volume decreases during sustained phonation. Intensity typically decreases similarly. Distinguishing drift from slow modulation requires arbitrarily choosing timescales—is a 0.5-Hz frequency decrease drift or extremely slow modulation?
Trends: Directed changes over time, such as glissando, crescendo, or decrescendo. These violate stationarity by definition but represent intentional control rather than instability.
Transients: Abrupt changes including voice onset, offset, register breaks, or phoneme transitions in connected speech. Analyzing windows containing transients produces misleading results for measures assuming stationarity.
Modulation: Regular cyclic variations (vibrato, tremor) represent bounded nonstationarity. The signal oscillates but within stable limits. Whether such modulation severely violates stationarity depends on the analysis timescale relative to the modulation period.
Practical Implications
Stationarity assumptions dictate appropriate analysis window lengths. Windows must be:
- Short enough to approximate stationarity, excluding trends and limiting drift effects
- Long enough to provide stable statistical estimates and adequate spectral resolution
- Appropriately positioned to avoid transients and represent typical voice quality
For sustained vowels, 1-3 second windows typically balance these requirements. For connected speech or modulated voices, shorter windows or specialized nonstationary analysis methods become necessary.
Quasi-Periodicity and Voice Quality
The degree of quasi-periodicity—how much voices deviate from perfect periodicity—relates systematically to perceived voice quality, though the relationship proves complex and multidimensional.
Optimal Quasi-Periodicity
Moderate quasi-periodicity may enhance voice quality compared to perfect periodicity. Singers generally prefer and produce voices with small amounts of F₀ and amplitude variation, which listeners judge as warmer, more human, and more expressive than synthesized perfectly periodic tones. This suggests that the auditory system evolved to process and prefer naturally occurring quasi-periodic signals over artificial perfect periodicity.
Excessive Deviations
Beyond optimal ranges, increasing aperiodicity degrades voice quality. Large perturbations create perceived roughness, hoarseness, or breathiness. Extreme aperiodicity produces noisy voice quality approaching whisper. The transition from acceptable quasi-periodicity to pathological aperiodicity depends on perturbation magnitude, voice type, context, and individual listener sensitivity.
Measurement Challenges
Quantifying modulation and periodicity faces several technical challenges:
Distinguishing Components: Separating intentional modulation from random perturbation and systematic trends requires signal processing techniques including spectral analysis, filtering, and detrending. No single method perfectly isolates these components.
Nonstationary Analysis: Accurately characterizing time-varying signals requires methods that relax stationarity assumptions, such as short-time spectral analysis, wavelet transforms, or empirical mode decomposition. These methods increase computational complexity and interpretation difficulty.
Multi-Parameter Interaction: FM, AM, and phase relationships interact in producing overall voice quality. Measuring each independently may miss important combined effects. Comprehensive characterization requires coordinated multi-parameter assessment.
Summary
Voice signals are quasi-periodic rather than perfectly periodic, exhibiting both systematic modulations and random perturbations. Fundamental frequency modulation and amplitude modulation characterize many voices, particularly in singing with vibrato or in pathological conditions with tremor. The phase relationship between FM and AM affects spectral structure and perceived quality.
Harmonics-to-noise ratio quantifies the relative energy in periodic versus aperiodic signal components, providing a robust measure across a wide range of voice qualities. Signal stationarity assumptions underlie most analysis methods but are violated to varying degrees by real voices, necessitating careful window selection and sometimes specialized nonstationary analysis techniques. The degree of quasi-periodicity relates to voice quality in complex, non-monotonic ways, with optimal voice production requiring moderate rather than zero deviation from perfect periodicity.
Key Takeaways
- ✅ Voice signals are quasi-periodic with systematic modulations superimposed on random perturbations, not perfectly periodic
- ✅ Fundamental frequency modulation creates spectral sidebands and is characterized by rate, depth, and regularity
- ✅ Amplitude modulation often occurs simultaneously with FM, with phase relationships affecting spectral structure and quality
- ✅ Vibrato typically shows in-phase FM and AM, while pathological tremor may exhibit different phase patterns
- ✅ Harmonics-to-noise ratio quantifies periodic versus aperiodic energy, remaining valid across severe dysphonia where jitter/shimmer fail
- ✅ Normal HNR ranges from 15-25 dB; values below 10 dB indicate substantial noise and dysphonia
- ✅ Stationarity assumptions underlying most analyses are violated by drift, trends, transients, and modulation
- ✅ Moderate quasi-periodicity may enhance voice quality; excessive deviation creates perceived roughness and dysphonia
Related Topics
Further Reading
- Schoentgen, J., & De Guchteneere, R. (1995). Time series analysis of jitter. Journal of Phonetics, 23(1-2), 189-201.
- Ladefoged, P., & McKinney, N. P. (1963). Loudness, sound pressure, and subglottal pressure in speech. Journal of the Acoustical Society of America, 35(4), 454-460.
- Yumoto, E., Gould, W. J., & Baer, T. (1982). Harmonics-to-noise ratio as an index of the degree of hoarseness. Journal of the Acoustical Society of America, 71(6), 1544-1550.
- Sundberg, J. (1994). Perceptual aspects of singing. Journal of Voice, 8(2), 106-122.