The F1-F2 Vowel Chart
The F1-F2 vowel chart provides a fundamental framework for understanding how vowel quality is encoded acoustically. By plotting vowels according to their first two formant frequencies (F1 and F2), this two-dimensional representation reveals systematic relationships between articulatory configurations and acoustic outputs. The F1-F2 space organizes vowels in a pattern that mirrors the traditional vowel quadrilateral, demonstrating that formant frequencies capture the essential acoustic information for vowel identity and perception.
Historical Development of Vowel Formant Analysis
The systematic study of vowel acoustics through formant analysis emerged from advances in acoustic theory and measurement technology in the mid-twentieth century.
Early Acoustic Observations
Before formant theory was fully developed, researchers recognized that vowels had characteristic “resonance regions” or areas of spectral emphasis:
Hermann’s Resonance Theory (1894): Ludimar Hermann proposed that vowels could be characterized by resonances of the vocal tract, though the precise physical mechanism remained unclear. He observed that each vowel had characteristic frequency regions where acoustic energy concentrated.
Willis’s Vowel Tubes (1830s): Earlier still, Robert Willis demonstrated that vowel-like sounds could be produced by blowing air through tubes of different shapes, suggesting that vocal tract shape determined vowel quality independent of the sound source.
Development of Source-Filter Theory
The theoretical foundation for understanding vowels through formants emerged from acoustic tube theory:
Fant’s Acoustic Theory (1960): Gunnar Fant’s seminal work “Acoustic Theory of Speech Production” provided rigorous mathematical foundations for relating vocal tract shape to formant frequencies. Fant demonstrated that the vocal tract acts as an acoustic filter, with formants representing its resonant frequencies.
Peterson and Barney Study (1952): This landmark study measured F1 and F2 for 10 American English vowels produced by 76 speakers (men, women, and children). The resulting F1-F2 plot showed clear clustering of vowel categories despite considerable speaker variability, establishing the utility of the formant-based approach.
Technological Advances
Practical formant measurement became feasible through technological developments:
Sound Spectrograph (1940s): Developed at Bell Laboratories, this device produced visual spectrograms showing how frequency content varied over time, making formant patterns visible and measurable.
Linear Predictive Coding (1960s-70s): Computational methods for extracting formant frequencies from digital speech signals automated and improved formant analysis, enabling large-scale studies.
The Acoustic Vowel Space
The F1-F2 vowel space represents a two-dimensional acoustic domain where each vowel occupies a characteristic region.
Coordinate System
The vowel chart typically uses formant frequencies as coordinate axes:
Horizontal Axis (F2): Conventionally plotted left-to-right, often with decreasing values (high F2 on left, low F2 on right) to mirror articulatory space.
Vertical Axis (F1): Conventionally plotted bottom-to-top, with low F1 at top and high F1 at bottom, again mirroring tongue height in articulation.
This orientation aligns the acoustic space with the traditional articulatory vowel quadrilateral, facilitating intuitive interpretation.
Coordinate Values
For adult speakers, F1-F2 coordinates span considerable ranges:
F1 Range: Approximately 200-1000 Hz for most vowels
- High vowels (like /i/, /u/): F1 ≈ 200-400 Hz
- Mid vowels (like /e/, /o/): F1 ≈ 400-600 Hz
- Low vowels (like /a/): F1 ≈ 600-1000 Hz
F2 Range: Approximately 600-3000 Hz
- Back vowels (like /u/, /o/): F2 ≈ 600-1200 Hz
- Central vowels (like /ə/): F2 ≈ 1200-1800 Hz
- Front vowels (like /i/, /e/): F2 ≈ 1800-3000 Hz
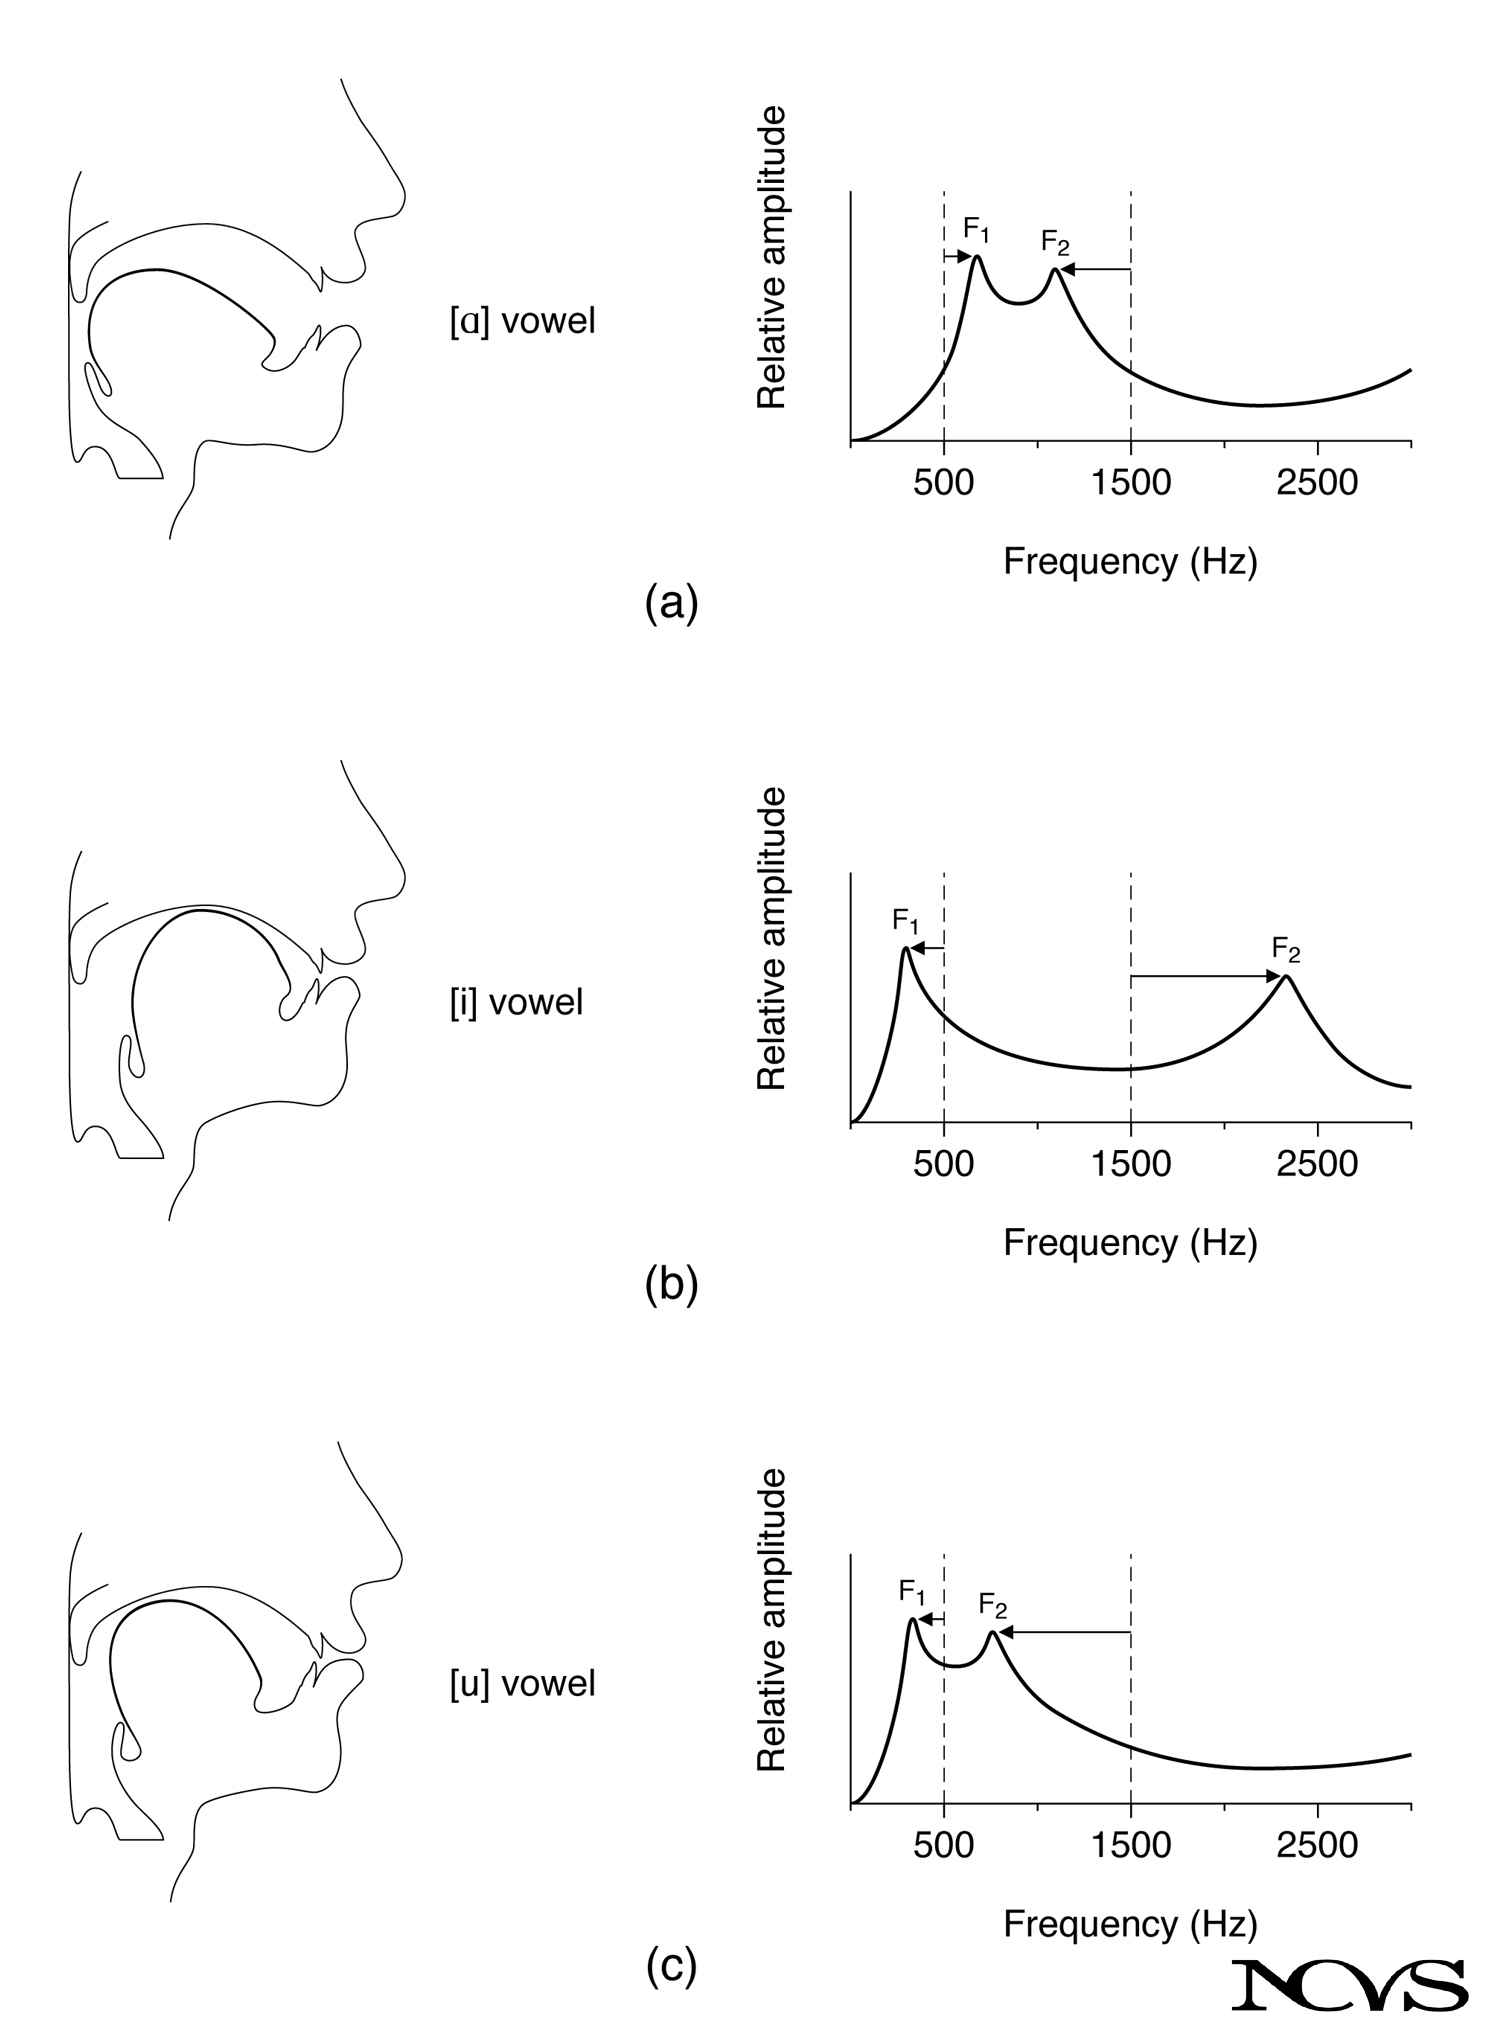 Figure 6.8: The F1-F2 vowel space showing typical formant values for major vowel categories in American English.
Speaker Variability
Absolute formant frequencies vary considerably across speakers due to anatomical differences:
Sex Differences: Female vocal tracts average 15-20% shorter than male tracts, resulting in proportionally higher formant frequencies (approximately 17-20% higher on average). Children have even higher formants due to smaller dimensions.
Normalization: Despite absolute differences, relative formant patterns remain consistent. Ratios like F2/F1 or differences like F2-F1 show less variability across speakers and are used in normalization procedures.
Vowel Space Area: Total acoustic vowel space area (measured in Hz² in F1-F2 plane) is often smaller for dysphonic speakers or those with reduced articulatory precision, making it a useful clinical metric.
Articulatory-Acoustic Relationships
The F1-F2 space systematically reflects articulatory dimensions of vowel production.
F1 and Tongue Height
F1 correlates strongly with tongue height (vertical tongue position):
Inverse Relationship: Higher tongue position produces lower F1; lower tongue position produces higher F1.
Physical Basis: Tongue height determines the size of the pharyngeal cavity behind the primary tongue constriction. A high tongue creates a large pharynx (low acoustic mass, low inertia) and small oral cavity, lowering F1. A low tongue creates a smaller pharynx and larger oral cavity, raising F1.
Quantitative Pattern:
High vowels (/i/, /u/): F1 ≈ 250-350 Hz
Mid-high vowels (/e/, /o/): F1 ≈ 400-500 Hz
Mid-low vowels (/ɛ/, /ɔ/): F1 ≈ 500-700 Hz
Low vowels (/æ/, /a/): F1 ≈ 700-1000 Hz
Clinical Significance: Speakers with limited vertical jaw/tongue movement (e.g., due to temporomandibular dysfunction or neurological impairment) show compressed F1 ranges, with insufficient distinction between high and low vowels.
F2 and Tongue Advancement
F2 correlates strongly with tongue advancement (horizontal tongue position):
Direct Relationship: More anterior tongue position produces higher F2; more posterior tongue position produces lower F2.
Physical Basis: Tongue advancement determines where along the vocal tract the primary constriction occurs. Front constrictions create a long pharyngeal cavity (back cavity) and short oral cavity (front cavity). This configuration raises F2. Back constrictions reverse this pattern, lowering F2.
Quantitative Pattern:
Front vowels (/i/, /e/, /ɛ/): F2 ≈ 1800-2800 Hz
Central vowels (/ə/, /ʌ/): F2 ≈ 1200-1600 Hz
Back vowels (/u/, /o/, /ɔ/): F2 ≈ 700-1200 Hz
Lip Rounding Effect: Lip rounding lowers all formants but affects F2 most strongly. Compare /i/ (unrounded, F2 ≈ 2300 Hz) with /y/ (rounded front vowel, F2 ≈ 1800 Hz).
F2-F1 Difference
The F2-F1 difference captures an important acoustic dimension:
Large F2-F1 Difference: Characteristic of front vowels, especially high front vowels like /i/ (F2-F1 might be 1800-2000 Hz or more).
Small F2-F1 Difference: Characteristic of back vowels, especially back rounded vowels like /u/ (F2-F1 might be only 500-800 Hz).
Perceptual Relevance: The F2-F1 difference relates to the perceived “compactness” or “diffuseness” of a vowel, an early distinctive feature theory concept.
Jaw Opening
While F1 primarily reflects tongue height, jaw opening also contributes:
Coupled Effects: Lowering the jaw typically accompanies lowering the tongue, both raising F1. However, jaw position can be manipulated somewhat independently of tongue position.
Singing Applications: Singers often open the jaw more than necessary for speech to enhance acoustic coupling and resonance, which can shift formants in complex ways beyond simple F1 raising.
The Vowel Quadrilateral Correspondence
The acoustic F1-F2 space remarkably mirrors the articulatory vowel quadrilateral.
Traditional Articulatory Description
The vowel quadrilateral (or vowel trapezoid) describes vowels according to:
- Vertical dimension: Tongue height (high, mid, low)
- Horizontal dimension: Tongue advancement (front, central, back)
- Lip rounding: Additional dimension (rounded vs. unrounded)
Acoustic Correspondence
When F1-F2 space is oriented appropriately (F1 increasing downward, F2 decreasing rightward), the acoustic vowel space forms a quadrilateral closely matching the articulatory one:
Top-left region (low F1, high F2): High front vowels like /i/, /ɪ/
Top-right region (low F1, low F2): High back vowels like /u/, /ʊ/
Bottom-center region (high F1, mid F2): Low central vowels like /a/, /ɑ/
Intermediate positions: Mid vowels occupy positions between these corners, with front mid vowels (/e/, /ɛ/) in the left center and back mid vowels (/o/, /ɔ/) in the right center.
Quantitative Mapping
The correspondence is systematic enough that formant values can predict articulatory configurations and vice versa, though the relationship is not perfectly linear throughout the vowel space.
Corner Vowels: The extreme vowels /i/, /a/, /u/ define the boundaries of both articulatory and acoustic vowel spaces. These are often called “point vowels” because they represent articulatory and acoustic extremes.
Vowel Dispersion: Languages tend to distribute vowels relatively evenly throughout the available vowel space (both articulatory and acoustic), maximizing perceptual distinctiveness—a principle called “vowel dispersion theory.”
Perceptual Significance of Formant Patterns
The F1-F2 pattern carries the essential acoustic information for vowel identification.
Sufficiency of F1 and F2
Numerous perception experiments have demonstrated that F1 and F2 alone are often sufficient for vowel identification:
Synthetic Speech: Two-formant synthesizers (varying only F1 and F2) can produce recognizable vowels, though naturalness is limited without higher formants.
Formant Tracking: When F1 and F2 are extracted from natural speech and used to control a synthetic vowel synthesizer, listeners can identify words with high accuracy, confirming that F1-F2 patterns encode vowel identity.
Pattern Playback: Early experiments with pattern playback devices showed that hand-painted spectrograms with only F1 and F2 visible produced identifiable vowels.
Role of Higher Formants
While F1 and F2 are primary for vowel identity, higher formants contribute:
F3 for /r/-colored vowels: In American English, lowered F3 is characteristic of rhoticity (r-coloring), as in words like “bird” or “fur.”
F3 for front rounded vowels: Languages with front rounded vowels (like French /y/, /ø/) use F3 patterns to distinguish these from back rounded vowels.
Overall quality and naturalness: F3 and F4 contribute to overall vowel quality, speaker characteristics, and naturalness, even if not strictly necessary for vowel category identification.
Categorical Perception
Vowel perception shows both categorical and continuous aspects:
Within-Category Variation: Listeners perceive formant variations within a vowel category as instances of “the same vowel,” showing phonetic categories.
Between-Category Boundaries: Formant patterns falling between categories may be perceived as intermediate or ambiguous, but boundaries between categories are generally clear.
Context Effects: Vowel perception is influenced by surrounding phonetic context, speaking rate, and speaker characteristics, with listeners adaptively normalizing across speakers.
Clinical Applications of F1-F2 Analysis
The vowel chart provides valuable diagnostic and treatment tools for voice and speech disorders.
Vowel Space Area as Clinical Metric
Reduced Vowel Space: Many disorders result in compressed acoustic vowel space:
- Dysarthria: Neurological impairment limiting articulatory range produces smaller vowel space area
- Hearing impairment: Reduced auditory feedback can limit vowel differentiation
- Parkinson’s disease: Hypokinetic dysarthria often results in centralized vowels with compressed F1-F2 space
Measurement: Vowel space area can be quantified by measuring the area of a polygon connecting corner vowels in F1-F2 space, providing an objective metric of articulatory working space.
Treatment Monitoring: Changes in vowel space area during therapy provide objective evidence of improvement in articulatory precision and range.
Dialect and Accent Analysis
Regional Variation: Different dialects show systematic F1-F2 pattern differences. For example, the Northern Cities Vowel Shift in American English involves rotational movements of several vowels in F1-F2 space.
Accent Modification: For speakers seeking to modify accent, F1-F2 target values for specific vowels in the target dialect provide concrete acoustic goals.
Forensic Applications: Speaker identification and forensic linguistics use F1-F2 patterns as part of speaker-specific acoustic profiles.
Surgical and Medical Interventions
Post-surgical monitoring: After oral or pharyngeal surgery affecting vocal tract shape:
- F1-F2 patterns reveal acoustic consequences of structural changes
- Tracking formant changes over recovery period documents adaptation
- Comparing pre- and post-surgery vowel spaces quantifies functional impact
Orthodontic effects: Dental and jaw alignment changes can affect vowel production, particularly F2 values for front vowels. F1-F2 analysis documents these effects.
Pediatric Assessment
Developmental norms: Children’s vowel spaces change systematically with growth. Age-appropriate F1-F2 reference data allow assessment of whether a child’s vowel production is developing typically.
Early intervention: Children with cleft palate, hearing loss, or developmental delays may show abnormal vowel space patterns, identifying them for early intervention.
Vowel Modification and Training
Understanding F1-F2 relationships informs pedagogical approaches to vowel modification.
Formant Tuning in Singing
Formant-Harmonic Alignment: Singers can adjust vowels to align a formant with a harmonic of F0, enhancing that harmonic’s amplitude and creating a louder, more resonant tone.
F1 Tuning Strategy: For high pitches where F0 exceeds normal F1 values, singers raise F1 (lower jaw, lower tongue) to align F1 with F0 or low harmonics. This explains the tendency toward /a/-like vowels on high notes.
Vowel Modification Rules: Teachers instruct singers to modify vowels systematically (e.g., “sing /i/ but think /e/” on high notes) to achieve appropriate F1-F2 combinations for acoustic efficiency.
Speech Clarity Enhancement
Vowel Space Expansion: Therapy targeting expanded articulatory movement aims to increase vowel space area, improving vowel differentiation.
Clear Speech Strategies: Speakers can enhance intelligibility by:
- Increasing F1 range (greater vertical tongue movement)
- Increasing F2 range (greater front-back tongue contrast)
- Slowing rate to allow fuller articulatory targets
Biofeedback Applications
Real-time formant displays: Software displaying F1-F2 in real time provides visual biofeedback for:
- Vowel accuracy training in second language learning
- Dysarthria therapy targeting specific vowel contrasts
- Singing pedagogy for vowel modification
Target-based training: Displaying target F1-F2 regions and current production allows learners to adjust articulation to hit acoustic targets.
Cross-Linguistic Vowel Systems
Languages vary considerably in the number of vowels and their distribution in F1-F2 space.
Minimal Vowel Systems
Some languages have very small vowel inventories:
Three-vowel systems (e.g., Arrernte, Central Australia): /i/, /a/, /u/ occupy the three corners of the vowel space, maximizing acoustic and perceptual contrast.
Five-vowel systems (e.g., Spanish, Japanese, Swahili): /i/, /e/, /a/, /o/, /u/ distribute evenly around the vowel space, a common pattern worldwide.
Large Vowel Systems
Other languages have extensive vowel inventories:
English: 11-15 vowels (depending on dialect) densely populate F1-F2 space, including tense-lax contrasts and diphthongs.
French: 12-16 vowel phonemes including front rounded vowels (/y/, /ø/, /œ/) that expand the vowel space into regions unused in English.
Danish: Approximately 16-27 vowel qualities (depending on analysis) make extensive use of F1-F2 space with fine-grained distinctions.
Vowel Harmony Systems
Some languages (e.g., Turkish, Hungarian, Finnish) show vowel harmony where vowels within words must match in certain features:
Front-back harmony: Reflected in F2 patterns—all vowels in a word have similar F2 (all front or all back).
Height harmony: Reflected in F1 patterns—vowels within words have similar F1 values (similar tongue height).
F1-F2 analysis reveals the acoustic basis of these phonological patterns.
Limitations and Extensions
While powerful, the F1-F2 framework has limitations that researchers have addressed through extensions.
Information Beyond F1-F2
F3 and Higher Formants: Complete vowel quality, speaker characteristics, and certain phonemic contrasts require F3 and higher formants.
Temporal Dynamics: Static F1-F2 values ignore time-varying aspects of vowels, especially important for diphthongs and vowels in connected speech.
Amplitude Patterns: The relative amplitudes of formants (not just frequencies) contribute to vowel quality, particularly vocal effort and loudness perception.
Alternative Representations
Bark Scale: Converting Hertz to Bark (psychoacoustic) scale provides axes more closely aligned with auditory perception.
Mel Scale: Similar to Bark, the mel scale represents perceived pitch and may better reflect perceptual vowel space.
Principal Components: Statistical analyses (PCA) of vowel formants can identify dimensions of variation that may not align exactly with F1 and F2 but capture important variance in vowel production.
Dynamic Vowel Analysis
Formant Trajectories: Plotting F1-F2 trajectories over time reveals vowel dynamics:
- Target undershoot in rapid speech
- Diphthong characterization
- Coarticulatory influences from surrounding consonants
Multiple Temporal Samples: Measuring formants at vowel onset, midpoint, and offset provides more complete characterization than single-point measurements.
Summary
The F1-F2 vowel chart provides a two-dimensional acoustic representation of vowel quality based on the first and second formant frequencies. This acoustic vowel space systematically reflects articulatory dimensions, with F1 inversely related to tongue height (low F1 for high vowels, high F1 for low vowels) and F2 directly related to tongue advancement (high F2 for front vowels, low F2 for back vowels). The resulting F1-F2 distribution mirrors the traditional articulatory vowel quadrilateral, with corner vowels /i/, /a/, /u/ occupying the extremes of the space.
The F1-F2 pattern carries the primary acoustic information for vowel identity, with these two formants often sufficient for vowel recognition in perceptual experiments. The vowel space area, measured in F1-F2 coordinates, provides a useful clinical metric, with reduced areas associated with various speech and voice disorders including dysarthria and hearing impairment. Applications span clinical assessment and treatment, singing pedagogy through formant tuning strategies, accent modification, and cross-linguistic analysis of vowel systems ranging from minimal three-vowel inventories to complex systems with 15 or more vowels. While F1 and F2 capture the essential acoustic structure of vowels, extensions incorporating higher formants, temporal dynamics, and perceptually-based frequency scales provide more complete characterizations of vowel production and perception.
Key Takeaways
- ✅ The F1-F2 vowel chart plots vowels in a two-dimensional acoustic space defined by the first two formant frequencies
- ✅ F1 inversely correlates with tongue height: high vowels have low F1 (250-350 Hz), low vowels have high F1 (700-1000 Hz)
- ✅ F2 directly correlates with tongue advancement: front vowels have high F2 (1800-2800 Hz), back vowels have low F2 (700-1200 Hz)
- ✅ The acoustic F1-F2 space mirrors the articulatory vowel quadrilateral when oriented with F1 increasing downward and F2 decreasing rightward
- ✅ F1 and F2 together carry sufficient information for vowel identification, though higher formants contribute to quality and naturalness
- ✅ Vowel space area in F1-F2 coordinates provides an objective clinical metric, with reduced area indicating articulatory limitation
- ✅ Cross-speaker variability in absolute formant frequencies requires normalization, but relative patterns remain consistent
- ✅ Applications include clinical assessment, singing pedagogy through formant tuning, accent modification, and cross-linguistic vowel analysis
Related Topics
- Vowel Shapes
- Three-Tube Approximation
- Quarter-Wave Resonance
- Formant Bandwidth
- Fourier Transformation
- The Spectral Slope
Further Reading
- Peterson, G. E., & Barney, H. L. (1952). Control methods used in a study of the vowels. Journal of the Acoustical Society of America, 24(2), 175-184.
- Fant, G. (1960). Acoustic Theory of Speech Production. The Hague: Mouton.
- Stevens, K. N. (1998). Acoustic Phonetics. Cambridge, MA: MIT Press.
- Hillenbrand, J., Getty, L. A., Clark, M. J., & Wheeler, K. (1995). Acoustic characteristics of American English vowels. Journal of the Acoustical Society of America, 97(5), 3099-3111.
- Titze, I. R. (2000). Principles of Voice Production (2nd ed.). Iowa City: National Center for Voice and Speech.
- Ladefoged, P., & Johnson, K. (2014). A Course in Phonetics (7th ed.). Boston: Cengage Learning.