The Sound Spectrograph
Figure 6.13: A sound spectrograph. Photo courtesy of Kay Elemetrics Corporation.
The sound spectrograph is an instrument that gives a variety of visual representations of the frequencies of a signal over time. Understanding this tool is essential for practical voice analysis in clinical, pedagogical, and research settings.
The Spectrogram Display
In the spectrogram display:
-
Horizontal axis: Time
-
Vertical axis: Frequency
-
Gray scale (or color): Amplitude
This three-dimensional representation (time × frequency × amplitude) provides a comprehensive view of how the acoustic signal changes over time.
Operating Principle
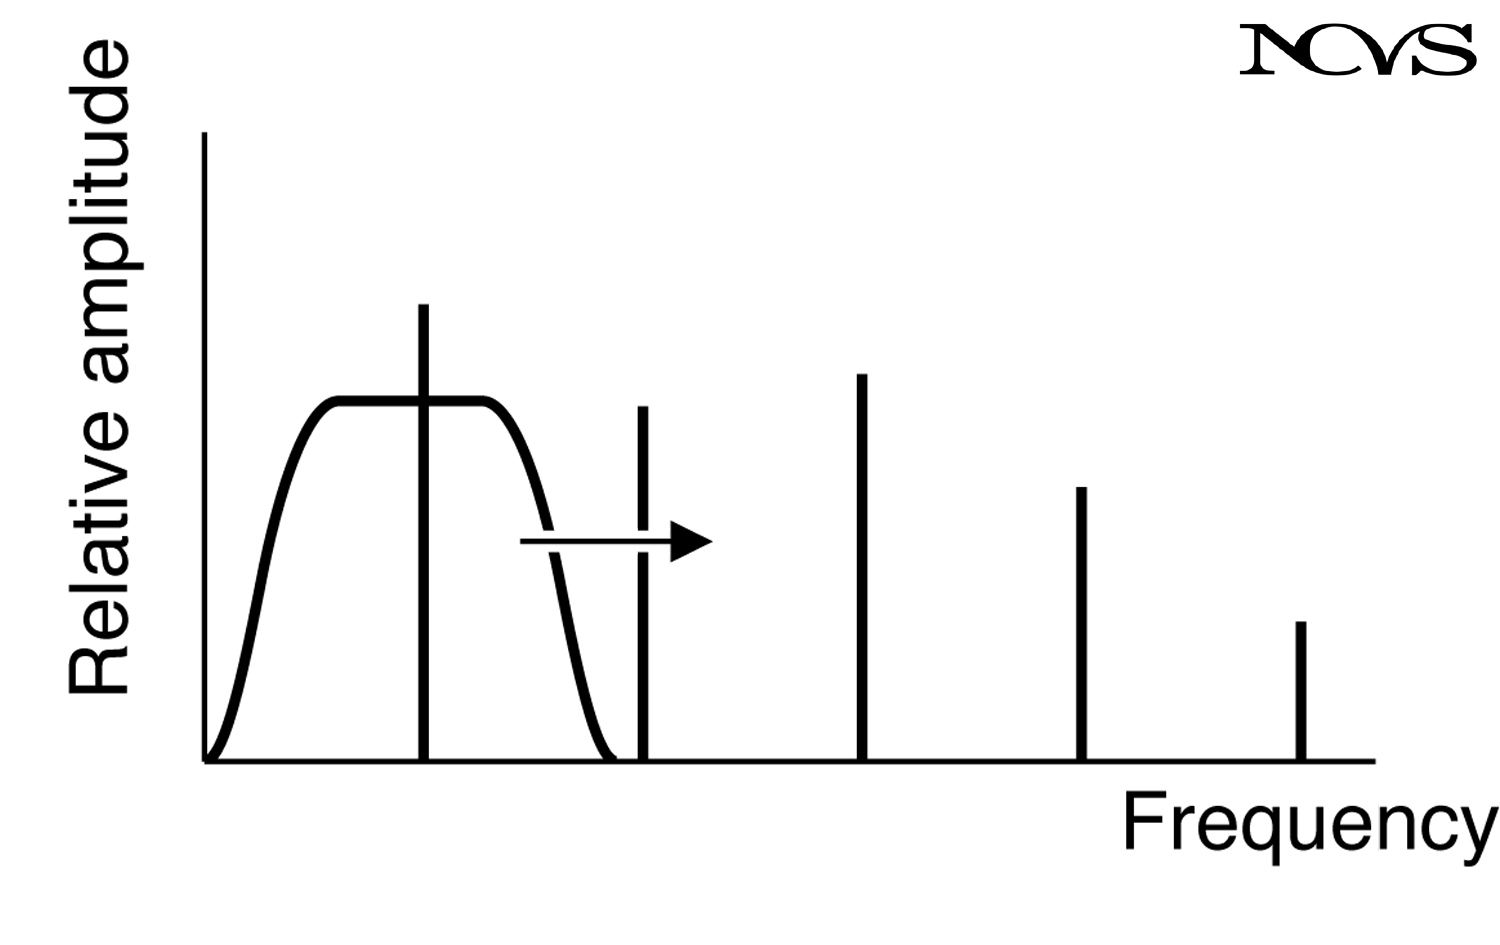
Figure 6.21: A variable-frequency band-pass filter moving through a line spectrum to produce a spectrogram.
Conceptually, the main element inside a spectrograph is a variable-frequency band-pass filter.
The Filtering Process
-
Input: Waveform with line spectrum at one instant of time
-
Filter movement: Passband moves gradually from lowest to highest frequency of interest
-
Energy detection: Combined energies of frequencies in the passband are coded as darkness
-
Time progression: Process repeats for successive instants of time
-
Output: Gray-scale continuum showing frequency content over time
Key principle: If two or three frequency lines (harmonics) are passed simultaneously, their energies are averaged together and drawn as a dark point. As the filter moves upward in frequency, the points are smoothly connected.
Wideband vs. Narrowband Analysis
The spectrograph performs two kinds of analyses by selecting different filter bandwidths.
Wideband Analysis (Broadband Filter)
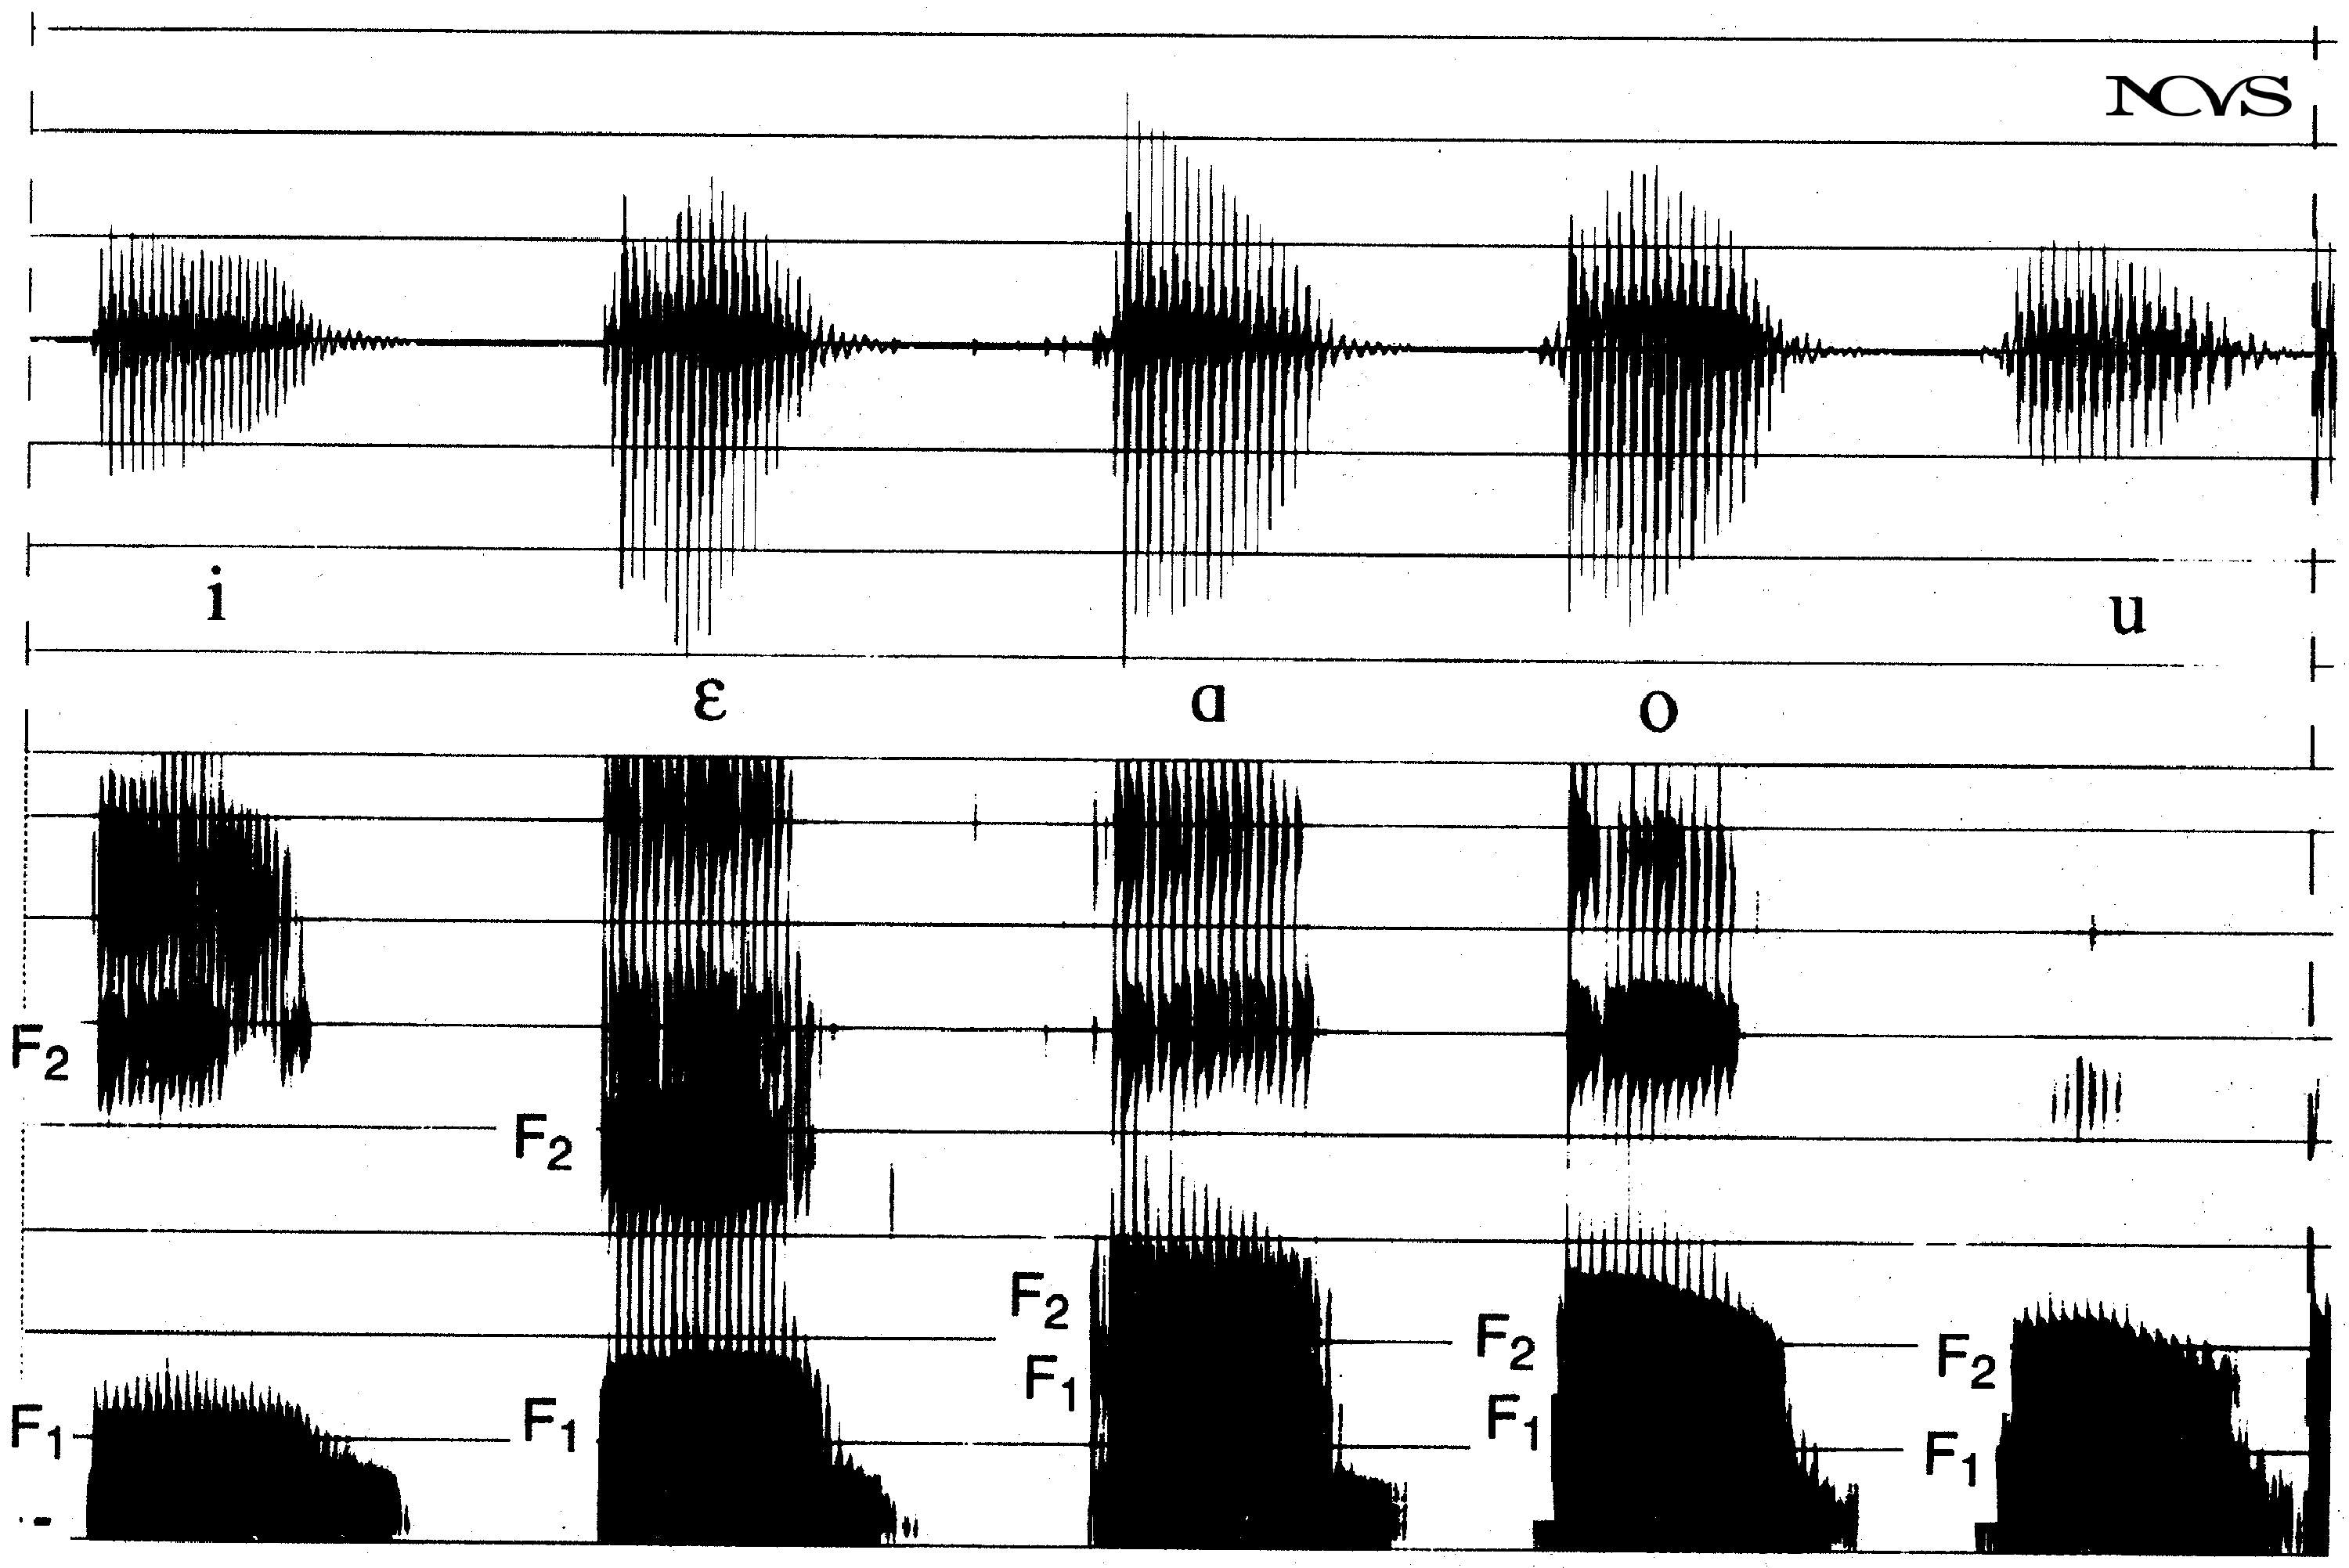
Figure 6.22: Time waveform and broadband spectrogram of the vowel sequence [i e a o u].
Filter characteristics:
-
Bandwidth: 300-500 Hz
-
Passes 2-5 harmonics simultaneously (when F₀ = 100-200 Hz)
-
Averages energy from multiple harmonics
Spectral display:
-
Dark horizontal bands: Formants (F₁, F₂, F₃, etc.)
-
Smooth formant contours: Energy from multiple harmonics averaged
-
Formant structure emphasized over individual harmonics
Temporal display:
-
Vertical striations: Individual periods of vibration visible
-
Good time resolution: Can see glottal cycles
-
Striations align with time waveform above spectrogram
Applications:
-
Identifying formant frequencies
-
Tracking formant movements during vowel transitions
-
Measuring formant bandwidths
-
Determining F₀ by counting striations
F₀ measurement:
Count vertical striations and divide by time interval:
F₀ = Number of striations / Time interval (seconds)
Narrowband Analysis
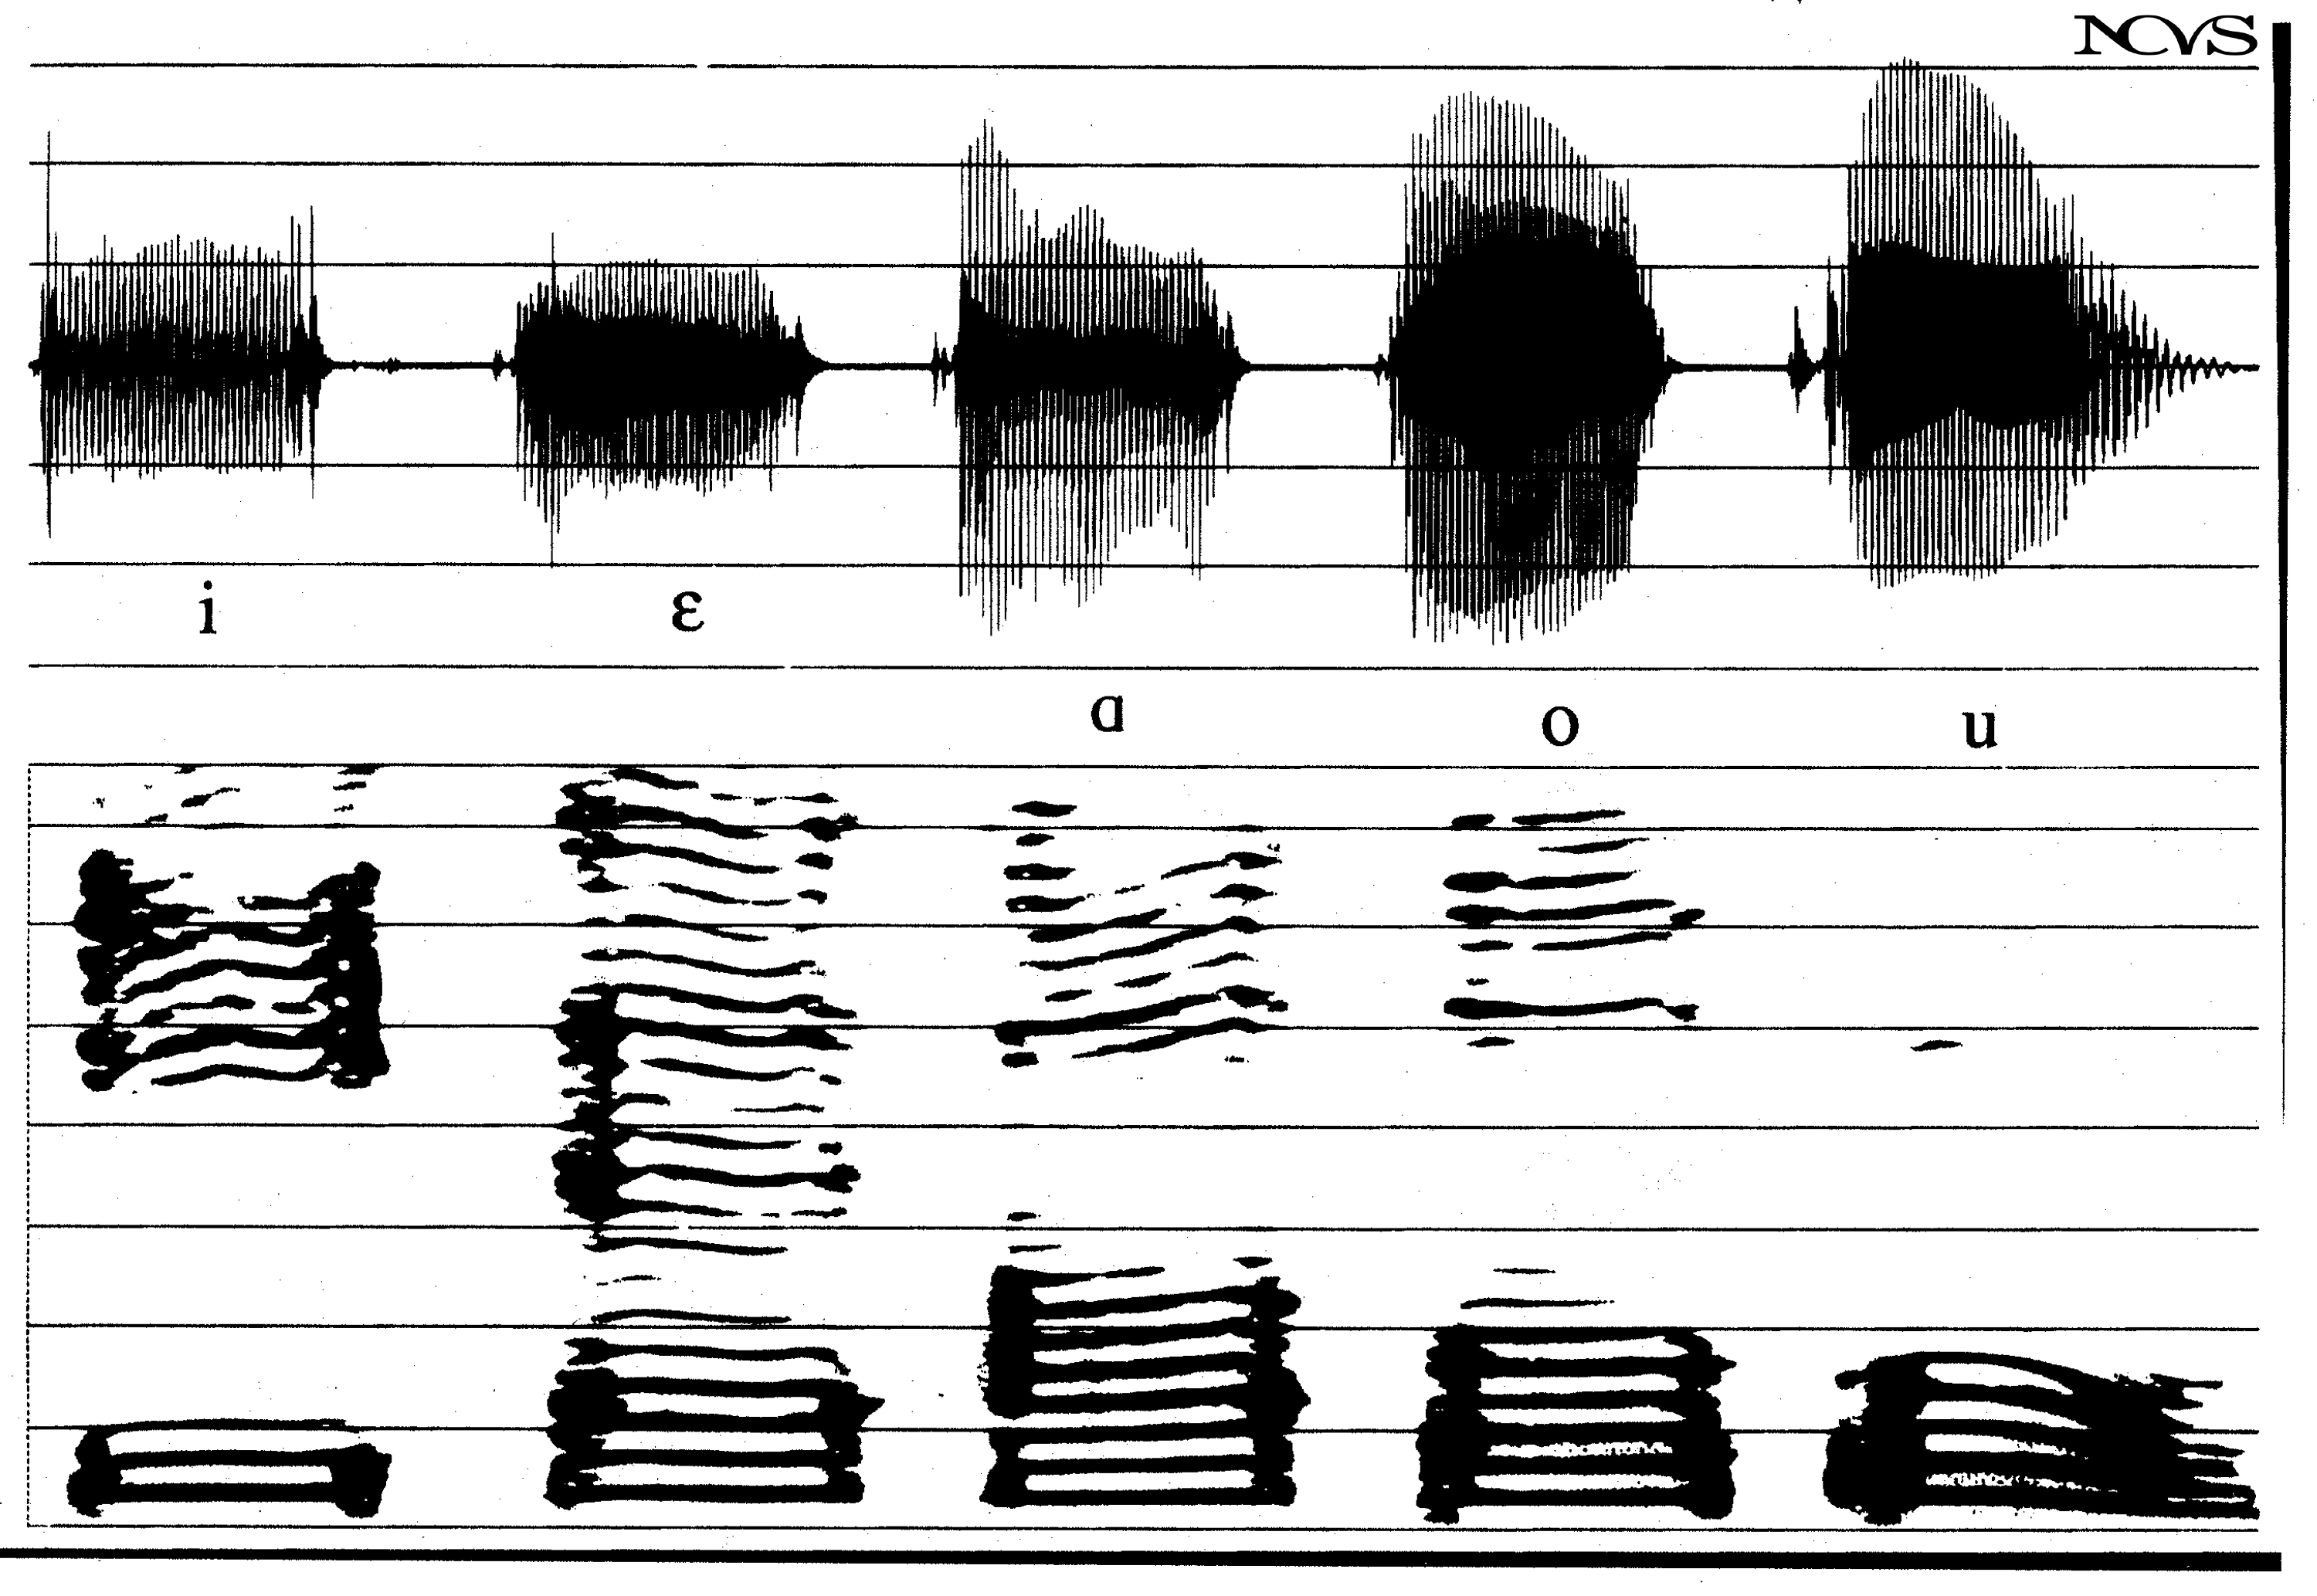
Figure 6.23: Time waveform and narrowband spectrogram of the vowel sequence [i e a o u].
Filter characteristics:
-
Bandwidth: 45-50 Hz
-
Passes only one harmonic at a time (unless F₀ is very low)
-
Resolves individual harmonics
Spectral display:
-
Dark horizontal lines: Individual harmonics
-
Line spacing: Equals F₀
-
Individual harmonic intensities revealed
-
Energy between harmonics not filled in
Temporal display:
-
No vertical striations: Filter lacks time resolution for individual cycles
-
Poor time resolution: Cannot respond to individual periods
-
Smooth in time dimension
Applications:
-
Analyzing high-pitched singing (resolving harmonics)
-
Measuring harmonic amplitudes
-
Studying source characteristics
-
Identifying F₀ from harmonic spacing
F₀ measurement:
Measure spacing between adjacent harmonics:
F₀ = Spacing between harmonics (Hz)
Comparing the Two Analyses
| Feature | Wideband (300-500 Hz) | Narrowband (45-50 Hz) |
|---------|----------------------|---------------------|
| Shows | Formants (broad bands) | Harmonics (fine lines) |
| Frequency resolution | Poor (averages harmonics) | Good (resolves harmonics) |
| Time resolution | Good (shows striations) | Poor (no striations) |
| Best for | Formant tracking, speech sounds | F₀ tracking, singing analysis |
| F₀ measurement | Count striations | Measure harmonic spacing |
The Time-Frequency Trade-off
The choice between wideband and narrowband reflects a fundamental trade-off:
Wide bandwidth:
-
Good time resolution (Δt small)
-
Poor frequency resolution (Δf large)
-
Δt × Δf relationship maintained
Narrow bandwidth:
-
Poor time resolution (Δt large)
-
Good frequency resolution (Δf small)
-
Δt × Δf relationship maintained
This trade-off is a direct consequence of the inverse time-frequency relationship discussed in the Fourier transformation section.
Practical Reading of Spectrograms
Identifying Vowels
On a wideband spectrogram:
-
Locate dark horizontal bands: These are formants
-
Measure F₁: Lowest dark band (usually 200-900 Hz)
-
Measure F₂: Second dark band (usually 700-2500 Hz)
-
Compare to vowel chart: Determine vowel category
Identifying Consonants
Voiced consonants:
-
Show formant structure (like vowels)
-
May have additional noise components
-
Vertical striations present
Voiceless consonants:
-
Random noise patterns (fricatives)
-
Silent gaps (stops)
-
No vertical striations
-
High-frequency energy (especially [s], [∫])
Measuring F₀
From wideband spectrogram:
-
Count vertical striations in 0.1 second
-
Multiply by 10 to get F₀ in Hz
From narrowband spectrogram:
-
Measure distance between adjacent harmonics
-
This distance equals F₀
Applications in Voice Science
Research Applications
-
Formant frequency studies: Document F₁, F₂, F₃ patterns
-
Vowel transition analysis: Track formant movements
-
Speaker characteristics: Compare formant patterns across speakers
-
Singing voice: Analyze formant tuning strategies
Clinical Applications
-
Voice quality assessment: Visual documentation of acoustic characteristics
-
Treatment documentation: Before-and-after comparisons
-
Biofeedback: Real-time display during therapy
-
Differential diagnosis: Identify acoustic correlates of pathology
Pedagogical Applications
-
Vowel modification training: Show formant changes in real-time
-
Resonance training: Visualize formant frequencies
-
Student demonstration: Make acoustics visible
-
Progress tracking: Document changes over training
Modern Spectrographic Software
Contemporary software implementations offer advantages over traditional hardware:
Features:
-
Adjustable filter bandwidths
-
Color displays
-
Real-time analysis
-
Multiple display formats
-
Measurement tools
-
Export capabilities
Examples:
-
Praat (free, widely used)
-
WaveSurfer
-
TF32
-
Kay Pentax software
-
Custom analysis platforms
Limitations and Considerations
Spectrographic limitations:
-
Cannot resolve harmonics below filter bandwidth
-
Trade-off between time and frequency resolution
-
Amplitude representation is relative, not absolute
-
Requires expertise for accurate interpretation
Best practices:
-
Choose appropriate bandwidth for analysis goal
-
Compare with time waveform
-
Use calibrated recordings
-
Consider speaker characteristics (F₀, vocal tract length)
-
Verify measurements with alternative methods
Summary
The sound spectrograph is an essential tool for vowel analysis that visually represents time, frequency, and amplitude simultaneously. It operates by sweeping a band-pass filter through the frequency range of interest. Wideband analysis emphasizes formant structure and provides good time resolution, showing vertical striations for each glottal cycle. Narrowband analysis emphasizes individual harmonics and provides good frequency resolution, useful for high-pitched voices and harmonic analysis. The choice between wideband and narrowband reflects the fundamental time-frequency trade-off. Modern software implementations have made spectrographic analysis widely accessible for research, clinical, and pedagogical applications.
Key Takeaways
-
✅ Spectrograms display time (horizontal), frequency (vertical), and amplitude (darkness)
-
✅ The spectrograph uses a variable-frequency band-pass filter that sweeps through frequencies
-
✅ Wideband (300-500 Hz) emphasizes formants with good time resolution and vertical striations
-
✅ Narrowband (45-50 Hz) emphasizes individual harmonics with good frequency resolution
-
✅ Choice of bandwidth reflects time-frequency trade-off (Δt × Δf)
-
✅ Applications span voice research, clinical assessment, and vocal pedagogy
Related Topics
Further Reading
-
Baken, R. J., & Daniloff, R. G. (1991). Readings in clinical spectrography of speech. San Diego: Singular Publishing Group.
-
Pickett, J. M. (1980). The sounds of speech communication. Baltimore: University Park Press.
-
Kent, R. D., & Read, C. (2002). Acoustic analysis of speech (2nd ed.). San Diego: Singular Publishing Group.