Frequency Spectra & Spectral Slope
The frequency spectrum provides a powerful alternative representation of acoustic signals, transforming time-domain waveforms into frequency-domain descriptions that reveal the distribution of energy across different frequencies. Understanding spectral analysis is essential for voice science, as the spectrum encodes critical information about vocal fold vibration, vocal tract filtering, and voice quality. This topic introduces the fundamental concepts of frequency spectra and spectral slope, which form the basis for acoustic analysis throughout voice research and clinical practice.
The Dual Nature of Acoustic Signals
Every acoustic signal can be represented in two complementary ways: as amplitude varying with time (time domain) or as amplitude varying with frequency (frequency domain). These representations contain identical information but emphasize different aspects of the signal.
Time-Domain Representation
The time-domain representation shows how acoustic pressure (or other quantities like flow or displacement) changes moment by moment:
Characteristics:
- Horizontal axis: Time (seconds, milliseconds)
- Vertical axis: Amplitude (pressure, flow, displacement)
- Shows temporal patterns: onsets, offsets, amplitude modulation
- Reveals periodicity through repetition of patterns
- Intuitive for understanding temporal sequences
Applications in Voice:
- Observing vocal fold opening and closing patterns
- Identifying moment of phonation onset
- Measuring fundamental period directly
- Detecting amplitude variations (shimmer)
The time-domain representation is familiar and intuitive—we naturally think of sounds as events unfolding over time. However, certain characteristics are difficult to extract from time-domain signals alone.
Frequency-Domain Representation
The frequency-domain representation (spectrum) shows how energy is distributed across different frequencies:
Characteristics:
- Horizontal axis: Frequency (Hz)
- Vertical axis: Amplitude or power at each frequency
- Shows spectral patterns: harmonics, formants, noise
- Reveals periodicity through harmonic structure
- Optimal for understanding resonance and filtering
Applications in Voice:
- Identifying harmonic structure and fundamental frequency
- Measuring formant frequencies
- Assessing harmonic-to-noise ratio
- Comparing spectral characteristics across voice qualities
The frequency-domain representation excels at revealing patterns that are obscured in the time domain, particularly the relative strengths of different frequency components.
The Fourier Transform
These two representations are related through the Fourier transform, a mathematical operation that converts between time and frequency domains:
Forward Transform (time → frequency):
X(f) = ∫ x(t) e^(-i2πft) dtInverse Transform (frequency → time):
x(t) = ∫ X(f) e^(i2πft) dfThe Fourier transform is reversible—no information is lost in either direction. Both representations contain complete information about the signal; they simply organize it differently.
Spectral Analysis of Periodic Signals
Periodic signals, such as the acoustic output during sustained vowel phonation, have particularly simple and interpretable spectra.
Line Spectra and Harmonics
A periodic signal with fundamental frequency F₀ produces a line spectrum consisting of discrete frequency components:
Fundamental: Component at frequency F₀, corresponding to the repetition rate of the waveform.
Harmonics: Components at integer multiples of F₀:
- 2nd harmonic: 2F₀
- 3rd harmonic: 3F₀
- 4th harmonic: 4F₀
- nth harmonic: nF₀
Each harmonic appears as a vertical line in the spectrum, with height representing amplitude (or power) at that frequency.
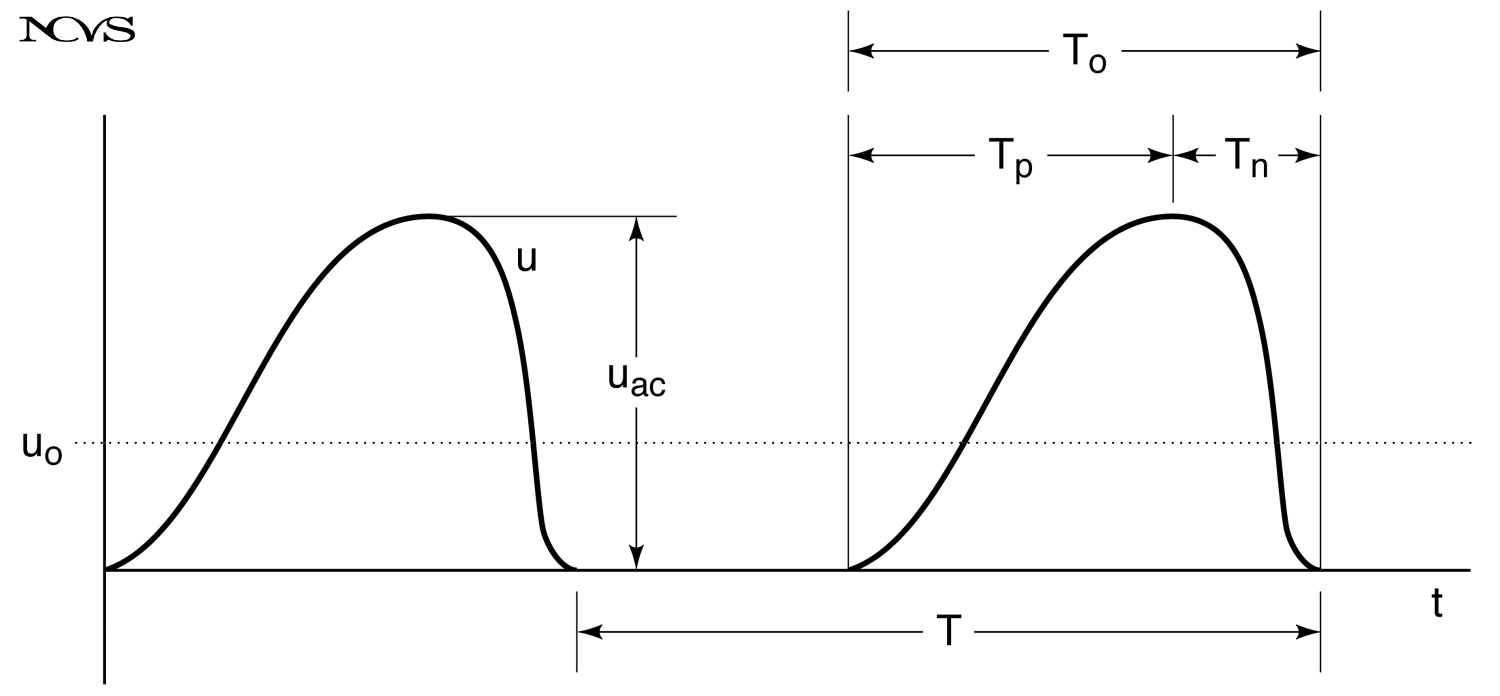 Figure 5.3: Time-domain waveform (top) and corresponding frequency spectrum (bottom) of a periodic voiced sound, showing fundamental frequency and harmonic series.
Harmonic Spacing
The spacing between adjacent harmonics equals the fundamental frequency:
Δf = f(n+1) - f(n) = (n+1)F₀ - nF₀ = F₀This constant spacing allows rapid identification of F₀ from the spectrum: simply measure the frequency difference between any two adjacent harmonics.
Example:
- If harmonics appear at 220 Hz, 440 Hz, 660 Hz, 880 Hz…
- Spacing = 440 - 220 = 220 Hz
- Therefore F₀ = 220 Hz
Harmonic Amplitude Patterns
The amplitude of each harmonic depends on the waveform shape in the time domain. Different waveform shapes produce characteristic spectral patterns:
Sinusoidal Waveform: Single component at fundamental frequency; all other harmonics have zero amplitude. This represents “pure tone” or simple harmonic motion.
Square Wave: Contains fundamental plus odd harmonics (3F₀, 5F₀, 7F₀, …) with amplitudes decreasing as 1/n.
Triangle Wave: Contains fundamental plus odd harmonics with amplitudes decreasing as 1/n².
Sawtooth Wave: Contains fundamental plus all harmonics (both odd and even) with amplitudes decreasing as 1/n.
Glottal Pulse: Approximates sawtooth or modified triangle, containing many harmonics with gradually declining amplitudes.
The specific pattern of harmonic amplitudes encodes the waveform shape—the spectrum is simply another way of describing the same information contained in the time-domain waveform.
Source-Filter Theory and Spectra
In voice production, the acoustic output spectrum results from interaction between source and filter components.
The Source Spectrum
The glottal source—periodic airflow pulses produced by vocal fold oscillation—generates a spectrum with:
Fundamental at F₀: Determined by vocal fold vibration rate Harmonic series: nF₀ for n = 1, 2, 3, … Spectral slope: Gradually declining amplitude with increasing frequency Typical slope: -12 dB/octave (amplitude decreases by factor of 4 for each frequency doubling)
The source spectrum depends primarily on the characteristics of vocal fold vibration: F₀, open quotient, waveform symmetry, and degree of glottal closure.
The Filter Function
The vocal tract acts as an acoustic filter, selectively amplifying some frequencies while attenuating others:
Resonances (Formants): Frequencies where vocal tract provides maximum amplification Anti-resonances: Frequencies where vocal tract provides attenuation Filter shape: Determined by vocal tract configuration (vowel shape)
The filter function modifies the source spectrum by multiplying each frequency component by the filter gain at that frequency.
Output Spectrum
The acoustic output spectrum is the product of source and filter:
Output Spectrum = Source Spectrum × Filter FunctionIn logarithmic units (dB):
Output (dB) = Source (dB) + Filter (dB)This source-filter theory (Fant, 1960) provides the fundamental framework for understanding voice acoustics. The source provides the raw acoustic energy organized into harmonics, while the filter shapes the spectral envelope by emphasizing formant regions.
Spectral Envelope
The spectral envelope is a smooth curve connecting the peaks of spectral components, representing the overall frequency response independent of the fine harmonic structure.
Defining the Envelope
For voiced sounds with many harmonics:
- Individual harmonics appear as vertical lines (fine structure)
- Envelope connects the harmonic peaks (coarse structure)
- Envelope shape reflects vocal tract filtering (formant pattern)
The envelope can be extracted through various methods:
- Linear predictive coding (LPC) analysis
- Cepstral analysis
- Peak-picking and interpolation
Formant Structure
The spectral envelope reveals formant peaks—broad regions of enhancement corresponding to vocal tract resonances:
First formant (F1): Lowest frequency peak, typically 200-1000 Hz, related to jaw opening and tongue height.
Second formant (F2): Next peak, typically 800-2500 Hz, related to tongue front/back position.
Third formant (F3): Third peak, typically 2000-3500 Hz, related to tongue tip position and lip rounding.
Higher formants: F4, F5, etc., at higher frequencies, contribute to voice quality.
The formant frequencies characterize vowel identity—each vowel has a characteristic F1-F2 pattern.
Envelope vs. Fine Structure
Distinguishing envelope from fine structure is crucial:
Fine structure (harmonics): Determined by F₀, changes with pitch, provides voicing information.
Envelope (formants): Determined by vocal tract shape, changes with vowel, provides linguistic information.
Speech recognition and vowel identification rely primarily on envelope (formants), while pitch perception relies on fine structure (harmonics and F₀).
Clinical Applications
Spectral analysis provides valuable diagnostic information about voice function.
Normal Spectral Characteristics
Healthy voice production exhibits:
- Clear harmonic structure throughout the spectrum
- Smooth spectral envelope with identifiable formants
- Gradual amplitude decline with increasing frequency
- High signal-to-noise ratio (harmonics much stronger than background noise)
- Consistent F₀ across sustained phonation
Pathological Spectral Indicators
Voice disorders produce characteristic spectral alterations:
Increased Spectral Noise: Aperiodic energy between harmonics, indicating incomplete glottal closure, turbulent airflow, or irregular vibration. Quantified by harmonic-to-noise ratio (HNR).
Spectral Tilt Changes: Altered slope may indicate changes in glottal contact patterns, vocal fold stiffness, or phonation efficiency.
Missing Harmonics: Absence of expected harmonics suggests subharmonic oscillation modes or period doubling.
Additional Spectral Peaks: Extra peaks not at integer multiples of F₀ may indicate diplophonia (independent left-right fold vibration) or nonlinear oscillations.
Formant Frequency Shifts: May indicate structural changes (edema, lesions) or compensatory articulation.
Acoustic Analysis Protocols
Clinical voice assessment typically includes spectral measures:
- Fundamental frequency (F₀) and range
- Harmonic-to-noise ratio (HNR)
- Cepstral peak prominence (CPP)
- Spectral moments (mean, standard deviation)
- Long-term average spectrum (LTAS)
These measures complement time-domain perturbation measures (jitter, shimmer) in comprehensive voice assessment.
Practical Spectral Analysis
Modern voice analysis relies on computational methods for extracting spectral information.
Fast Fourier Transform (FFT)
The FFT algorithm efficiently computes the discrete Fourier transform:
Input: Time-domain signal sampled at regular intervals Output: Spectrum showing amplitude at discrete frequencies Resolution: Frequency resolution = sampling rate / number of points Windowing: Applies window function (Hamming, Hanning) to minimize edge effects
Typical Parameters for Voice:
- Sampling rate: 44.1 kHz or 22.05 kHz
- FFT size: 2048 or 4096 points
- Window: Hamming (25-50 ms duration)
- Frequency resolution: ~10-20 Hz
Spectrogram
The spectrogram displays how the spectrum changes over time:
Axes: Time (horizontal), frequency (vertical), amplitude (brightness/color) Wide-band: Short time windows (2-5 ms), good time resolution, vertical striations show glottal pulses Narrow-band: Long time windows (20-40 ms), good frequency resolution, horizontal striations show harmonics
The spectrogram combines time and frequency information, revealing both temporal patterns (phoneme sequences) and spectral patterns (formant trajectories, F₀ contours).
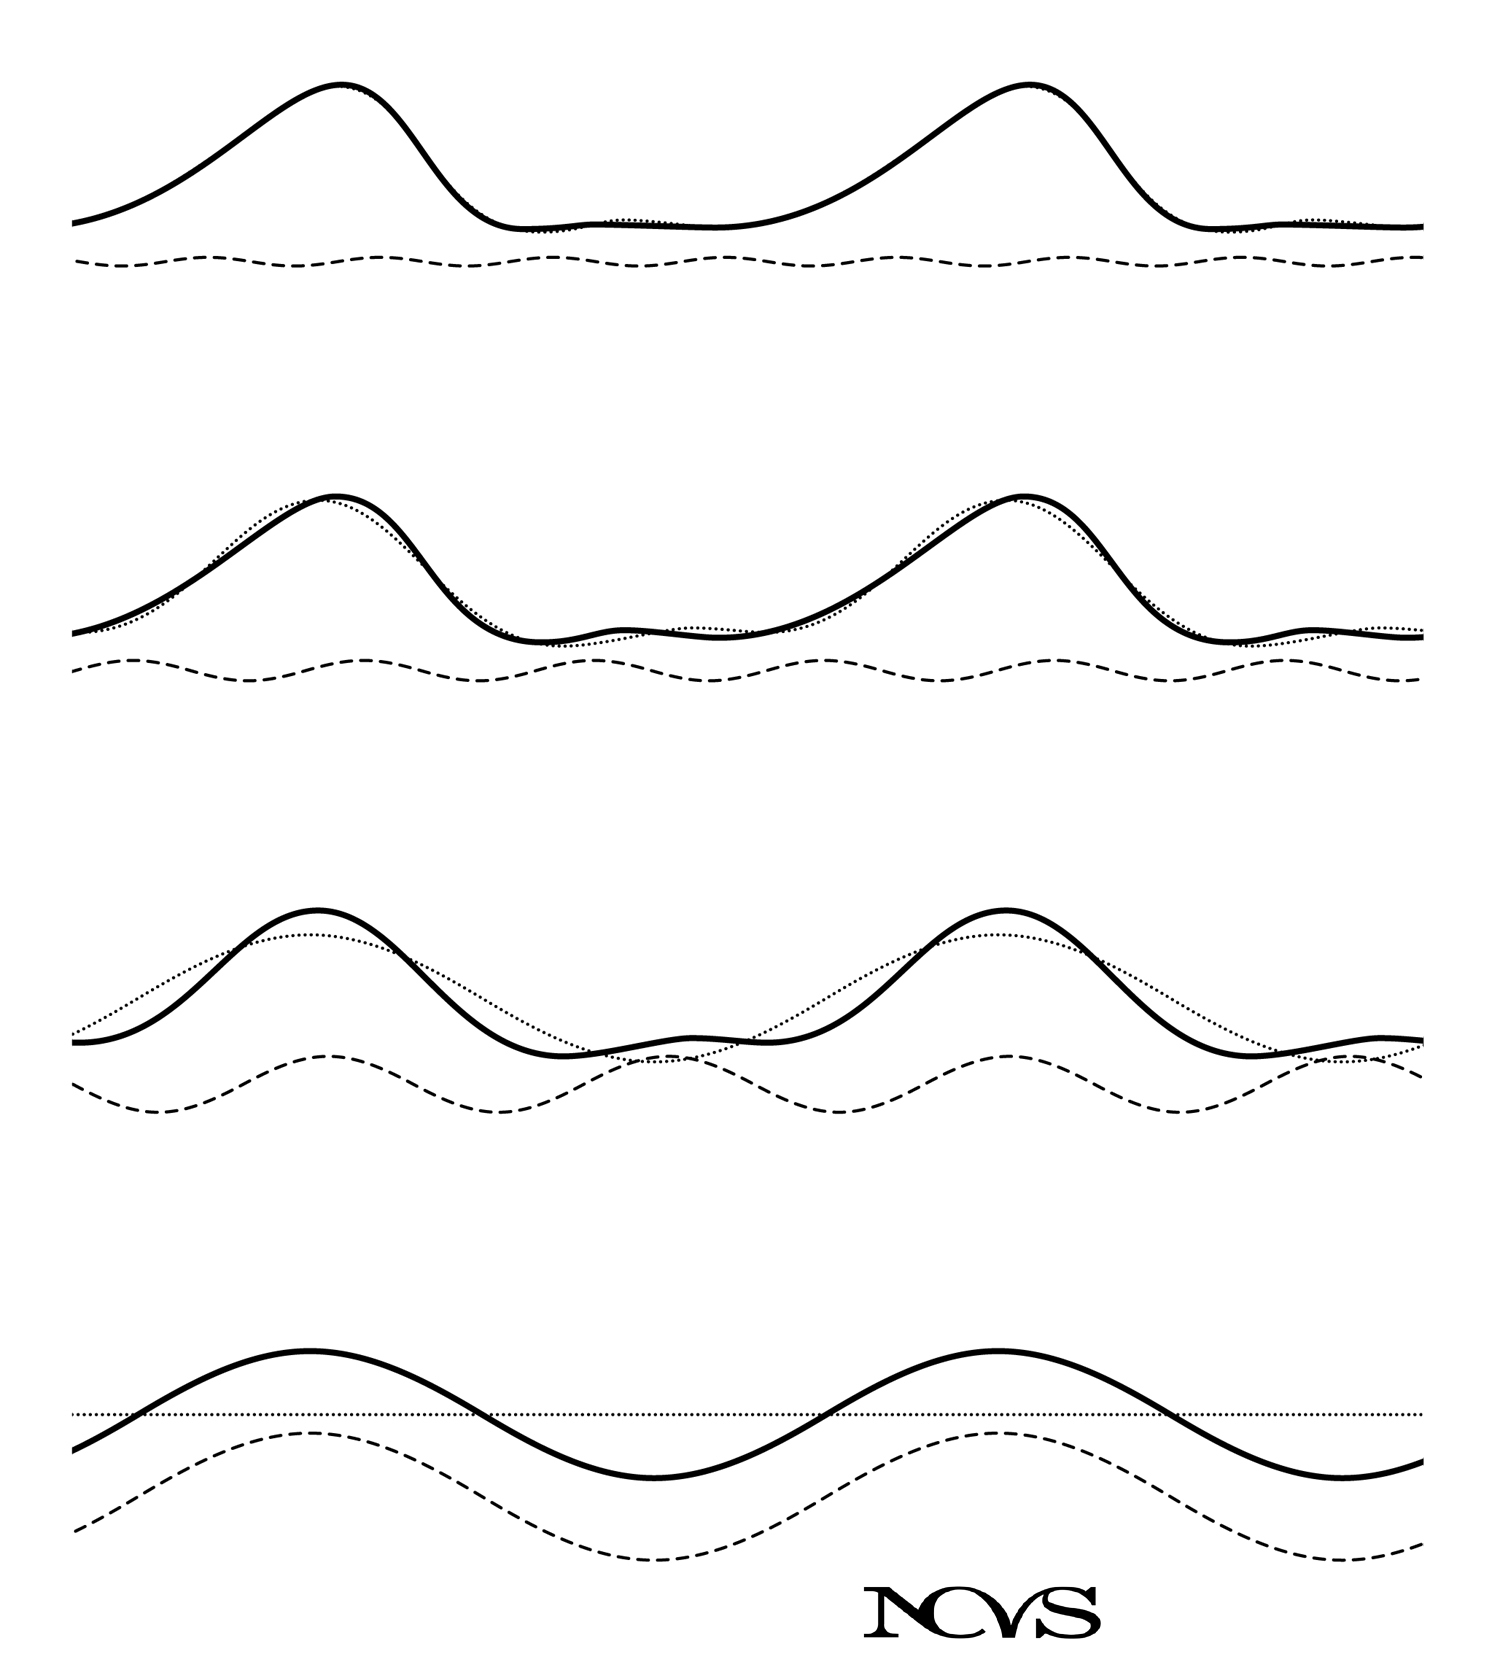 Figure 5.4: Wide-band and narrow-band spectrograms of speech showing complementary time-frequency resolutions.
Summary
Frequency spectra provide an alternative representation of acoustic signals that reveals the distribution of energy across frequencies. Periodic signals produce line spectra with components at the fundamental frequency F₀ and integer multiples (harmonics), with spacing equal to F₀. The pattern of harmonic amplitudes encodes the waveform shape in the time domain.
In voice production, source-filter theory explains how the glottal source spectrum (harmonics with declining amplitude) is modified by vocal tract filtering to produce the output spectrum with its characteristic formant envelope. The spectral envelope—the smooth curve connecting harmonic peaks—reflects vocal tract resonances and determines vowel quality, while the fine harmonic structure reflects vocal fold vibration characteristics and determines pitch.
Spectral analysis provides essential diagnostic information, with pathological voices showing increased spectral noise, altered spectral slope, missing or additional frequency components, and shifted formant frequencies. Modern computational tools like FFT and spectrograms enable detailed visualization and quantification of spectral characteristics for both research and clinical applications.
Key Takeaways
- ✅ Frequency spectra show amplitude distribution across frequencies, complementing time-domain representations
- ✅ Periodic signals produce line spectra with harmonics at integer multiples of F₀, spaced by F₀
- ✅ The Fourier transform provides reversible conversion between time and frequency domains
- ✅ Source-filter theory explains voice spectra as the product of glottal source and vocal tract filter
- ✅ Spectral envelope reflects formant structure (vowel quality) while fine structure reflects F₀ (pitch)
- ✅ Clinical voice assessment uses spectral measures including HNR, CPP, and LTAS
- ✅ FFT and spectrograms provide computational tools for spectral analysis in research and clinical settings
Related Topics
- The Meaning of a Spectrum
- The Spectral Slope
- The Glottal Source Function
- Periodicity
- Vocal Tract Resonance
Further Reading
- Fant, G. (1960). Acoustic Theory of Speech Production. The Hague: Mouton.
- Titze, I. R. (2000). Principles of Voice Production (2nd ed.). Iowa City: National Center for Voice and Speech.
- Baken, R. J., & Orlikoff, R. F. (2000). Clinical Measurement of Speech and Voice (2nd ed.). San Diego: Singular Publishing Group.
- Stevens, K. N. (1998). Acoustic Phonetics. Cambridge, MA: MIT Press.
- Hillenbrand, J., & Houde, R. A. (1996). Acoustic correlates of breathy vocal quality: Dysphonic voices and continuous speech. Journal of Speech and Hearing Research, 39(2), 311-321.