Dependence of Glottal Source Power on Lung Pressure and F0
The acoustic power generated at the glottis depends on the complex interaction between subglottal pressure and fundamental frequency (F0), two primary control variables in voice production. Understanding their combined influence reveals how speakers and singers coordinate respiratory and laryngeal systems to achieve desired intensity levels across different pitch ranges, and explains why certain pitch-intensity combinations are more efficient than others.
Theoretical Foundation
The relationship between glottal source power, pressure, and frequency emerges from fundamental aerodynamic and biomechanical principles.
Basic Power Relationship
Glottal Source Power
The acoustic power generated at the glottis (Pg) can be expressed approximately as:
Pg ∝ Ps² × F0 × ACWhere:
- Pg: glottal source power (watts)
- Ps: subglottal pressure (Pa or cm H₂O)
- F0: fundamental frequency (Hz)
- AC: AC flow (alternating component of glottal airflow)
- ∝: proportional to
This relationship indicates that glottal power increases with:
- Square of subglottal pressure (dominant factor)
- Fundamental frequency (linear factor)
- AC flow amplitude (depends on glottal configuration)
Pressure Dependence
Quadratic Relationship
The squared dependence on pressure arises from:
- Flow through glottis proportional to pressure
- Acoustic intensity proportional to flow velocity
- Combined effect yields pressure-squared dependence
- Doubling pressure approximately quadruples power
- This makes pressure highly effective for intensity control
Physical Interpretation
- Pressure drives glottal airflow
- Higher pressure increases flow amplitude
- Greater flow produces larger acoustic disturbances
- Power scales with flow amplitude squared
- Explains why small pressure changes yield large intensity changes
Frequency Dependence
Linear Relationship
Frequency affects source power through:
- Number of glottal pulses per second
- Each pulse contributes acoustic energy
- Higher F0 means more pulses per unit time
- Linear increase in power with frequency
- Effect weaker than pressure dependence
Spectral Considerations
- Higher F0 shifts spectral energy upward
- Harmonic spacing increases with F0
- May align differently with formants
- Affects radiated intensity beyond source power
- Interaction with vocal tract crucial
Combined Pressure-Frequency Effects
The simultaneous variation of pressure and F0 creates complex control space for intensity.
Isointensity Contours
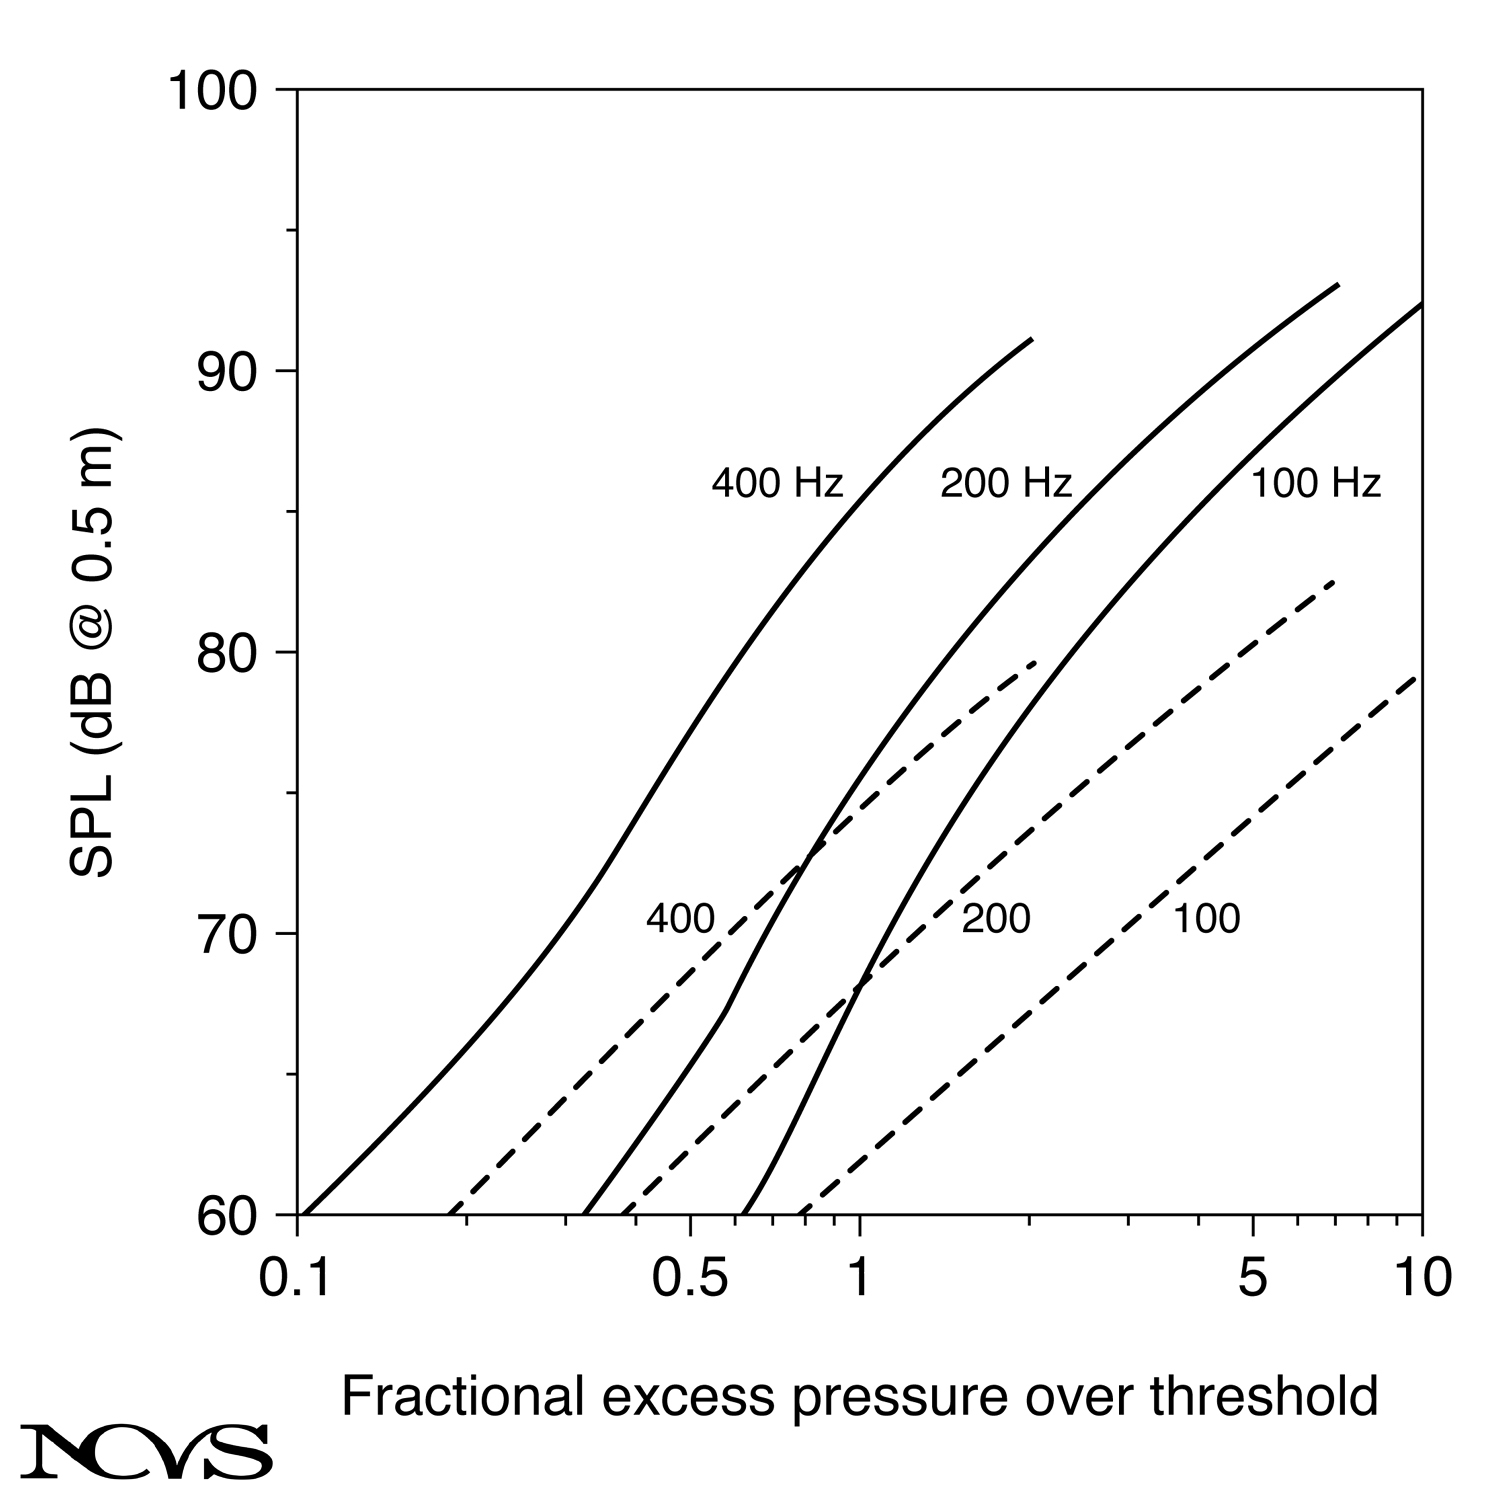 Figure 9.7: Isointensity contours in pressure-frequency space, showing curved lines of constant intensity requiring specific pressure-F0 combinations and illustrating the multiple ways to achieve a given output level.
Concept
- Lines connecting pressure-F0 combinations yielding same intensity
- Multiple strategies for same output level
- Curved contours reflect non-linear relationships
- Steeper at low frequencies
- Flatter at high frequencies
Characteristics of Isointensity Curves
For constant intensity output:
- As F0 increases, required pressure typically decreases slightly
- Relationship not strictly compensatory
- Curve shape depends on glottal configuration
- Individual variation in optimal strategies
- Training may shift contour patterns
Practical Control Strategies
Low-Frequency, High-Pressure Strategy
- Common in chest voice production
- Lower pitches with higher pressure
- Produces strong low-frequency energy
- May involve greater vocal fold mass engagement
- Requires substantial respiratory effort
High-Frequency, Moderate-Pressure Strategy
- Typical of head voice and falsetto
- Reduced pressure requirements at high pitch
- Thinner vocal fold configuration
- More efficient at high frequencies
- Less demanding on respiratory system
Optimal Combinations
- Balance between respiratory and laryngeal effort
- Minimize fatigue and strain
- Vary with vocal training and style
- Individual anatomical differences influential
- Context-dependent (speech versus singing)
Experimental Evidence
Research demonstrates systematic relationships between pressure, frequency, and intensity.
Empirical Relationships
Pressure Coefficient
Studies show intensity increases approximately:
ΔL ≈ 8-9 dB per doubling of pressure (above threshold)- Theoretical prediction from a pure pressure-squared law: 12 dB (4× power)
- Observed values: about 8-9 dB (Titze & Sundberg, 1992), with the excess pressure Pₛ − PTP as the relevant variable
- Variation due to glottal configuration changes
- Efficiency varies with pressure level
- Non-linear effects at extremes
Frequency Coefficient
Intensity increases approximately:
ΔL ≈ 3-6 dB per octave of F0- Theoretical prediction: 3 dB (2× frequency, assuming constant flow)
- Observed values: 3-6 dB
- Additional increase from spectral effects
- Formant interaction contributes
- Depends on vowel and vocal tract configuration
Individual Variation
Subject Differences
- Trained singers show more efficient pressure-intensity relationships
- Untrained speakers may require higher pressures
- Gender differences related to vocal fold size
- Age affects tissue properties and efficiency
- Pathology alters characteristic relationships
Measurement Considerations
- Direct glottal power difficult to measure
- Usually infer from radiated output
- Vocal tract filtering affects observation
- Multiple measurement distances needed
- Inverse filtering helps isolate source
Interaction with Vocal Fold Adduction
Adduction level modulates the pressure-frequency-intensity relationships.
Adduction Effects on Pressure Dependence
Light Adduction
- Requires higher pressure for given intensity
- More air leakage reduces efficiency
- Steeper pressure-intensity slope
- Less effective pressure-to-power conversion
- Breathy voice quality
Optimal Adduction
- Most efficient pressure-intensity relationship
- Minimal wasted airflow
- Strong AC flow component
- Best power conversion
- Modal voice quality
Heavy Adduction
- May reduce efficiency at low pressures
- Requires higher threshold pressure
- Can be efficient at high pressures
- Risk of excessive collision forces
- Pressed voice quality
Frequency-Dependent Adduction Adjustments
Low Frequencies
- Typically fuller adduction
- Greater vocal fold mass engaged
- Produces strong low harmonics
- Requires coordination with pressure
- Chest voice mechanism
High Frequencies
- Often reduced adduction
- Thinner vocal fold configuration
- Cricothyroid dominance
- Lower pressure requirements
- Head voice or falsetto mechanisms
Transitional Regions
- Register transitions involve adduction changes
- Coordination challenges
- Training focuses on smooth transitions
- Pressure adjustments accompany adduction shifts
- Critical for extended vocal range
Practical Implications for Voice Use
Understanding pressure-F0 interaction informs voice training and therapy.
Speech Production
Conversational Speech
- Relatively narrow F0 range (one octave or less)
- Intensity mainly controlled by pressure
- Frequency contribution secondary
- Habitual pitch generally efficient
- Minimal coordination demands
Emphatic Speech
- Combined pressure and F0 increases
- Stress patterns use both parameters
- F0 rise enhances pressure-driven intensity increase
- Perceptually salient
- Linguistically and emotionally significant
Projection and Distance Communication
- Primarily pressure-driven intensity increase
- May raise pitch slightly
- Optimal F0 for maximum efficiency
- Avoid excessive pitch elevation
- Training improves pressure efficiency
Singing Production
Dynamic Range Control
Singers must master pressure-F0 coordination:
- Pianissimo: minimal pressure, optimal F0
- Forte: high pressure, strategic F0
- Crescendo/decrescendo: primarily pressure variation
- Maintain pitch accuracy during intensity changes
- Independent control essential
Register-Specific Strategies
Chest Register
- Higher pressures typical
- Lower frequency range
- Strong pressure-intensity coupling
- Fuller vocal fold engagement
- Greater respiratory demands
Head Register
- Moderate pressures sufficient
- Higher frequency range
- Efficiency at elevated pitch
- Thinner vocal fold configuration
- Different pressure-intensity relationship
Mixed Register
- Balanced pressure-F0 coordination
- Optimizes both chest and head qualities
- Requires refined control
- Individual optimal balance
- Advanced skill development
Clinical Considerations
Voice Disorders Affecting Pressure-F0 Relationship
Glottal Incompetence
- Elevated pressure requirements
- Inefficient power conversion
- Reduced intensity capabilities
- Excessive air consumption
- Compensatory pitch adjustments may occur
Vocal Fold Stiffness
- Altered frequency-intensity relationship
- Higher pressures needed
- Reduced F0 flexibility
- Limited dynamic range
- Coordination difficulties
Hyperfunctional Voice
- Excessive pressure for given intensity
- Inefficient production
- Often accompanied by pitch elevation
- Tension patterns interfere
- Requires retraining of pressure control
Therapeutic Strategies
Optimizing Pressure Use
- Teach pressure monitoring (biofeedback)
- Reduce excessive pressure
- Increase pressure where insufficient
- Coordinate with respiratory training
- Improve efficiency through optimal pressure levels
F0 Optimization
- Find pitch range with best pressure efficiency
- Avoid habitually elevated or depressed pitch
- Use pitch flexibility to reduce pressure demands
- Register training for appropriate F0-pressure combinations
- Resonant voice techniques leverage optimal F0
Coordinated Control Training
- Semi-occluded vocal tract exercises
- Facilitate pressure-F0 coordination
- Provide biomechanical feedback
- Improve efficiency
- Reduce vocal fatigue
Measurement and Assessment
Quantifying pressure-F0-intensity relationships aids clinical evaluation.
Clinical Assessment Protocols
Pressure-Intensity Profiling
- Measure intensity across pressure range
- Control F0 (sustained vowel, fixed pitch)
- Vary pressure systematically
- Plot intensity versus pressure
- Compare to normative data
Frequency-Intensity Profiling
- Measure intensity across F0 range
- Control pressure (constant respiratory drive)
- Vary pitch systematically
- Plot intensity versus F0
- Assess coordination capability
Combined Assessment
- Measure across pressure-F0 grid
- Identify optimal combinations
- Reveal coordination deficits
- Guide treatment planning
- Document progress objectively
Interpretation Guidelines
Normal Patterns
- Systematic increase with pressure
- Gradual increase with F0
- Smooth isointensity contours
- Wide dynamic range achievable
- Efficient production evident
Pathological Patterns
- Excessive pressure requirements
- Reduced intensity output
- Irregular contours
- Limited dynamic range
- Coordination failures
Summary
Glottal source power depends on both subglottal pressure (squared relationship) and fundamental frequency (linear relationship), creating a complex control space where multiple pressure-F0 combinations can achieve similar intensity outputs. Isointensity contours reveal that speakers and singers can trade off pressure against frequency to some degree, though pressure remains the dominant control variable due to its quadratic influence. The pressure-intensity relationship typically yields about 8-9 dB per doubling of pressure above threshold, while frequency contributes several decibels per octave (about 3 dB from the source-power model alone; Chapter 7 quotes 8-9 dB per octave for the radiated sound once faster glottal closure and formant interaction are included), with actual values depending on glottal configuration, vocal fold adduction, and vocal tract resonance characteristics.
Adduction level critically modulates these relationships, with optimal adduction providing most efficient pressure-to-power conversion, while light adduction requires excessive pressure and heavy adduction increases threshold pressure. Different frequency ranges favor different adduction patterns, with low frequencies using fuller vocal fold engagement and high frequencies employing thinner configurations, requiring coordinated adjustments during pitch changes. Practical voice use exploits these relationships through register-specific strategies: chest voice uses higher pressures at lower frequencies, head voice employs moderate pressures at higher frequencies, and mixed register balances both systems.
Clinical assessment of pressure-F0-intensity relationships reveals coordination abilities and identifies pathological patterns such as glottal incompetence (elevated pressure requirements), vocal fold stiffness (altered frequency effects), and hyperfunctional voice (excessive pressure use). Therapeutic strategies optimize pressure efficiency, identify ideal pitch ranges for individual patients, and train coordinated control through techniques such as semi-occluded vocal tract exercises. Understanding these combined influences enables more sophisticated voice training, more accurate clinical assessment, and more targeted therapeutic interventions for voice disorders affecting intensity control.
Key Takeaways
- ✅ Glottal source power depends on pressure squared (dominant effect) and frequency linearly (secondary effect)
- ✅ Doubling lung pressure above threshold raises intensity about 8-9 dB; doubling frequency adds several dB more
- ✅ Isointensity contours show multiple pressure-F0 combinations can achieve same output level
- ✅ Optimal adduction provides most efficient pressure-to-power conversion; light or heavy adduction reduces efficiency
- ✅ Low frequencies typically use higher pressures and fuller vocal fold engagement (chest voice)
- ✅ High frequencies allow lower pressures with thinner vocal fold configurations (head voice)
- ✅ Coordinated pressure-F0 control essential for smooth register transitions and dynamic range
- ✅ Clinical assessment of pressure-F0-intensity relationships identifies pathology and guides therapy
Related Topics
- Phonation Threshold Pressure
- Dependence of Glottal Source Power on Adduction
- Effect of Lung Pressure on F0
- Vocal Tract Transfer Gain
- Voice Range Profile
Further Reading
- Titze, I. R. (1989). On the relation between subglottal pressure and fundamental frequency in phonation. Journal of the Acoustical Society of America, 85, 901-906.
- Holmberg, E. B., Hillman, R. E., & Perkell, J. S. (1988). Glottal airflow and transglottal air pressure measurements for male and female speakers in soft, normal, and loud voice. Journal of the Acoustical Society of America, 84, 511-529.
- Sundberg, J., Titze, I. R., & Scherer, R. (1993). Phonatory control in male singing: A study of the effects of subglottal pressure, fundamental frequency, and mode of phonation on the voice source. Journal of Voice, 7(1), 15-29.
- Titze, I. R. (1988). Regulation of vocal power and efficiency by subglottal pressure and glottal width. In O. Fujimura (Ed.), Vocal Physiology: Voice Production, Mechanisms and Functions (pp. 227-238). New York: Raven Press.
- Tanaka, S., & Gould, W. J. (1983). Relationships between vocal intensity and noninvasively obtained aerodynamic parameters in normal subjects. Journal of the Acoustical Society of America, 73, 1316-1321.