Glottal Source Power and Inverse Filtering
Measuring the acoustic power generated at the glottal source requires separating the effects of glottal airflow from vocal tract filtering. Inverse filtering provides the primary technique for recovering the glottal flow waveform from radiated speech pressure, enabling quantification of source power and analysis of how laryngeal adjustments affect acoustic output.
The Source-Filter Framework
Voice production involves two relatively independent subsystems that can be analyzed separately.
Fundamental Principle
Source-Filter Theory
- Source: glottal airflow generates acoustic excitation
- Filter: vocal tract modifies source spectrum
- Independence: source and filter approximately decoupled
- Linearity: system behaves approximately linearly
- Superposition: output = source × filter transfer function
Mathematical Representation
In the frequency domain:
P_rad(ω) = U_g(ω) × H_tract(ω) × H_rad(ω)Where:
- P_rad(ω): radiated pressure spectrum
- U_g(ω): glottal flow spectrum (source)
- H_tract(ω): vocal tract transfer function (filter)
- H_rad(ω): radiation transfer function
Advantages of Separation
- Isolates laryngeal function from articulatory effects
- Enables measurement of pure source characteristics
- Facilitates comparison across vowels and speakers
- Clarifies mechanisms of intensity control
- Essential for voice analysis and synthesis
Limitations of Direct Measurement
Invasive Techniques
- Direct glottal airflow measurement requires transglottal sensors
- Electroglottography (EGG) provides contact area, not flow
- High-speed videoendoscopy shows motion, not airflow
- Particle image velocimetry research-only, not clinical
- Practical clinical measurement requires indirect methods
Radiated Speech Limitations
- Microphone captures combined source-filter-radiation output
- Cannot directly observe glottal waveform
- Vocal tract formants obscure source characteristics
- Different vowels produce different spectra from same source
- Requires computational separation of components
Inverse Filtering Technique
Inverse filtering computationally removes vocal tract and radiation effects to recover glottal flow.
Basic Concept
Forward Process (Voice Production)
Glottal Flow → Vocal Tract → Radiation → Radiated PressureInverse Process (Analysis)
Radiated Pressure → Inverse Radiation → Inverse Vocal Tract → Glottal FlowMathematical Formulation
In the frequency domain:
U_g(ω) = P_rad(ω) / [H_tract(ω) × H_rad(ω)]Or equivalently:
U_g(ω) = P_rad(ω) × H_tract⁻¹(ω) × H_rad⁻¹(ω)Where H⁻¹ denotes the inverse transfer function.
Implementation Steps
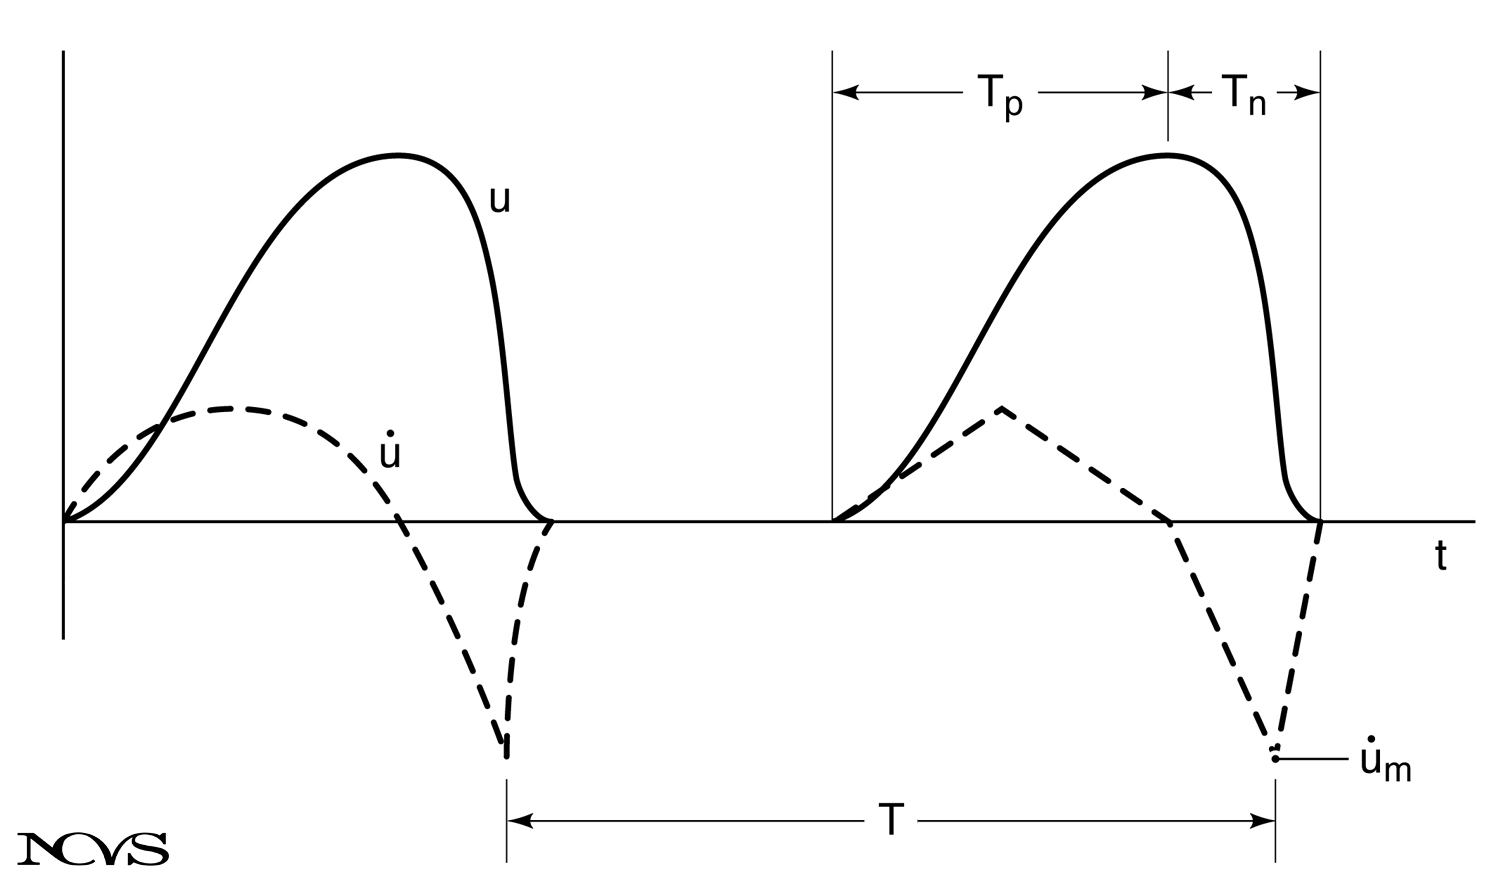 Figure 9.4: Block diagram of inverse filtering showing sequential removal of radiation and vocal tract effects to recover glottal flow from speech pressure signal.
Step 1: Remove Radiation Effect
The radiation characteristic (+6 dB/octave) is removed by integration:
- Time-domain: integrate the pressure signal
- Frequency-domain: divide by jω
- Result: volume velocity at lips
- Simple first-order operation
Step 2: Estimate Vocal Tract Transfer Function
Several methods exist:
- Linear prediction coding (LPC): assumes all-pole model
- Formant tracking: identifies resonance frequencies
- Cepstral analysis: separates source and filter
- Manual formant selection: interactive adjustment
Step 3: Remove Vocal Tract Filtering
Apply inverse of estimated vocal tract transfer function:
- Cancels formant peaks
- Removes anti-resonances
- Result: glottal flow waveform
- Sensitive to accurate formant estimation
Step 4: Verify and Refine
Check recovered waveform for:
- Realistic pulse shape
- Appropriate open quotient
- Smooth closure
- Minimal residual formant structure
- Iterate if necessary
Challenges and Sources of Error
Vocal Tract Estimation
- LPC order must be appropriate (typically 10-14 coefficients)
- Subglottal resonances can interfere
- Nasal coupling complicates model
- Time-varying tract during transients
- Individual anatomical variation
Source-Tract Coupling
- Assumption of independence not perfect
- Source impedance affects tract resonances
- Nonlinear effects at high amplitudes
- Particularly important for high-intensity phonation
- May require iterative refinement
Radiation Model Assumptions
- Simple integration assumes ideal point source
- Head/torso effects not captured
- Directivity ignored
- Adequate for most clinical purposes
- More sophisticated models available for research
Signal Quality Requirements
- High signal-to-noise ratio needed
- Calibrated microphone essential
- Steady phonation simplifies analysis
- Running speech more challenging
- Background noise problematic
Glottal Flow Waveform Characteristics
The recovered glottal flow reveals important source features.
Temporal Parameters
Open Phase Duration (T_o)
- Time when glottis open and airflow occurs
- Typically 40-70% of period in modal voice
- Related to open quotient Q_o = T_o/T
- Varies with adduction and pressure
Flow Rise Time (T_p)
- Time for flow to increase from onset to peak
- Usually 20-40% of period
- Gradual increase during opening
Flow Decline Time (T_n)
- Time for flow to decrease from peak to closure
- Usually 20-30% of period
- More rapid than rise time (skewing)
- Abruptness related to collision forces
Peak Flow Amplitude (U_peak)
- Maximum volume velocity during cycle
- Typically 200-800 cm³/s for conversational speech
- Scales with lung pressure and glottal opening
- Major determinant of source power
Derived Parameters
Skewing Quotient (Q_s)
Q_s = T_p / T_n- Values > 1.0 indicate skewed waveform
- Typical range: 1.0 to 2.0
- Related to closure abruptness
- Affects spectral slope
Maximum Flow Declination Rate (MFDR)
- Peak negative slope during closure
- Measured in liters/second/second
- Typical range: 200-2000 L/s/s
- Strong indicator of collision forces
- Correlates with high-frequency spectral energy
AC Flow Component
- Time-varying portion of flow
- Peak-to-peak amplitude
- Determines acoustic power
- Distinct from mean (DC) flow
Calculating Glottal Source Power
Power in the glottal source can be quantified from the recovered flow waveform.
Time-Domain Power Calculation
Instantaneous Power
At each time instant, power flow into the vocal tract:
P(t) = p_g(t) × u_g(t)Where:
- P(t): instantaneous power (watts)
- p_g(t): glottal pressure (subglottal pressure when open)
- u_g(t): glottal flow (volume velocity)
Average Glottal Source Power
P_avg = (1/T) ∫[0 to T] p_g(t) × u_g(t) dtWhere T is the fundamental period.
Practical Calculation
- Requires simultaneous pressure and flow measurement
- Pressure approximated by subglottal pressure estimate
- Integration over multiple cycles
- Typically 1-100 milliwatts for speech
Frequency-Domain Power Calculation
Spectral Power Density
From Parseval’s theorem:
P_avg = Σ|U_g(n)|² × R_tract(n)Where:
- U_g(n): glottal flow amplitude at harmonic n
- R_tract(n): real part of tract input impedance
- Σ: sum over all harmonics
Spectral Slope Relationship
- Glottal flow spectrum typically decreases ~12 dB/octave
- Power concentrated in low harmonics
- Fundamental and second harmonic carry most power
- High harmonics contribute little to total power
- Spectral richness distinct from total power
Typical Power Values
Conversational Speech
- Glottal source power: 1-10 milliwatts
- Radiated acoustic power: 10-100 microwatts
- Efficiency: 0.1-1% (very low)
- Most power dissipated as heat and viscous losses
Loud Speech/Singing
- Glottal source power: 10-100 milliwatts
- Radiated acoustic power: 100 microwatts to 1 milliwatt
- Efficiency: similar percentage range
- Absolute power increases but efficiency similar
Power Distribution
- Fundamental frequency: 30-50% of total power
- Second harmonic: 20-30% of total power
- Third harmonic: 10-15% of total power
- Higher harmonics: remaining power
- Distribution varies with voice quality
Relationship to Radiated Acoustic Power
The glottal source power exceeds radiated power due to losses.
Power Loss Mechanisms
Viscous Losses in Tissues
- Energy dissipated as heat in vocal fold tissue
- Damping during oscillation
- Typically 50-70% of glottal source power
- Increases with oscillation amplitude
Absorption in Vocal Tract Walls
- Acoustic energy absorbed by soft tissues
- Approximately 10-20% of source power
- Frequency-dependent (higher frequencies absorbed more)
- Yields tissue typically 20-30% of energy
Radiation Losses
- Only 1-10% of glottal source power radiated
- Most power lost before radiation
- Radiation efficiency low at speech frequencies
- Improves at high frequencies but still small fraction
Practical Implications
- Voice production extremely inefficient acoustically
- Most energy becomes heat
- Thermal loading of larynx significant during heavy voice use
- Cooling by respiration and blood flow essential
- Efficiency considerations guide vocal economy strategies
Transfer Functions
Glottal Power to Radiated Power
P_rad = P_glottal × η_tissue × η_tract × η_radiationWhere η represents efficiency at each stage:
- η_tissue: mechanical efficiency (~0.3-0.5)
- η_tract: transmission efficiency (~0.8-0.9)
- η_radiation: radiation efficiency (~0.01-0.1)
- Overall: typically 0.001-0.01 (0.1-1%)
Clinical Applications of Inverse Filtering
Inverse filtering provides valuable diagnostic and therapeutic information.
Voice Disorder Assessment
Glottal Insufficiency
- Incomplete closure increases DC flow
- Reduced AC flow amplitude
- Decreased glottal power
- Lower efficiency
- Breathy voice quality
Hyperfunction/Pressed Voice
- Very short open quotient
- High maximum flow declination rate
- Large collision forces
- Excessive glottal power for intensity achieved
- Risk of vocal trauma
Vocal Fold Paralysis
- Asymmetric flow waveform
- Irregular periodicity
- Reduced flow amplitude
- Low source power
- Poor voice intensity capability
Treatment Monitoring
Objective Measures
- Track changes in glottal waveform parameters
- Document improvements in closure pattern
- Monitor source power efficiency
- Compare pre/post therapy
- Quantify surgical outcomes
Examples
- Improved open quotient following medialization
- Reduced MFDR with relaxation techniques
- Increased AC flow with vocal function exercises
- Better waveform regularity with neural recovery
Research Applications
Inverse filtering enables investigation of voice production mechanisms.
Parametric Studies
Effect of Laryngeal Adjustments
- Isolate adduction effects on flow
- Examine F0 modulation independent of filtering
- Study registration phenomena
- Investigate coordination patterns
Pressure-Flow Relationships
- Measure flow at varying subglottal pressures
- Determine laryngeal flow resistance
- Calculate phonation threshold
- Model aerodynamic-mechanical coupling
Voice Synthesis and Modeling
Model Validation
- Compare synthetic flow waveforms with measured
- Refine model parameters
- Test theoretical predictions
- Develop improved voice simulators
Practical Applications
- Speech synthesis systems
- Voice modification algorithms
- Singing voice synthesis
- Clinical training simulations
Summary
Glottal source power quantifies the acoustic energy generated by vocal fold vibration, requiring inverse filtering techniques to separate source characteristics from vocal tract filtering and radiation effects. The inverse filtering process sequentially removes radiation (by integration) and vocal tract filtering (using LPC or formant tracking) to recover the glottal flow waveform from radiated speech pressure. The recovered waveform reveals temporal parameters including open quotient, skewing quotient, maximum flow declination rate, and peak flow amplitude that characterize laryngeal function.
Glottal source power, calculated from pressure-flow products or spectral power density, typically ranges from 1-10 milliwatts for conversational speech to 10-100 milliwatts for loud phonation, with only 0.1-1% ultimately radiated as acoustic power. The remaining energy dissipates through viscous losses in tissues (50-70%), absorption in vocal tract walls (10-20%), and other inefficiencies. Clinical applications include assessment of voice disorders (glottal insufficiency, hyperfunction, paralysis) and objective monitoring of treatment outcomes, while research applications enable parametric studies of laryngeal adjustments and validation of voice production models.
Despite challenges in vocal tract estimation and source-tract coupling assumptions, inverse filtering remains the primary non-invasive technique for measuring glottal source characteristics, providing essential insights into laryngeal function that radiated speech alone cannot reveal. Understanding glottal source power and its measurement through inverse filtering enables more precise characterization of voice disorders, more objective assessment of treatment effects, and deeper understanding of the biomechanical and aerodynamic basis of voice production.
Key Takeaways
- ✅ Inverse filtering separates glottal source from vocal tract filter by sequentially removing radiation and resonance effects
- ✅ Process involves integration (removing radiation) and inverse filtering (removing formants) to recover glottal flow waveform
- ✅ Recovered glottal flow reveals temporal parameters: open quotient, skewing quotient, MFDR, and peak flow amplitude
- ✅ Glottal source power ranges from 1-10 mW (conversational) to 10-100 mW (loud), calculated from pressure-flow products
- ✅ Only 0.1-1% of glottal source power ultimately radiates; most dissipates as heat in tissues and absorption
- ✅ Clinical applications include assessing glottal insufficiency, hyperfunction, and paralysis through objective waveform analysis
- ✅ Implementation challenges include accurate vocal tract estimation, source-tract coupling effects, and signal quality requirements
- ✅ Inverse filtering enables parametric studies of laryngeal function and validation of voice production models
Related Topics
- The Glottal Source Function
- Dependence of Glottal Source Power on Adduction
- Vocal Tract Transfer Gain
- Glottal Efficiency
- Vocal Fold Oscillation
Further Reading
- Rothenberg, M. (1973). A new inverse-filtering technique for deriving the glottal air flow waveform during voicing. Journal of the Acoustical Society of America, 53, 1632-1645.
- Alku, P. (1992). Glottal wave analysis with pitch synchronous iterative adaptive inverse filtering. Speech Communication, 11, 109-118.
- Holmberg, E., Hillman, R., & Perkell, J. (1988). Glottal airflow and transglottal air pressure measurements for male and female speakers in soft, normal and loud voice. Journal of the Acoustical Society of America, 84, 511-529.
- Titze, I. R. (2000). Principles of Voice Production (2nd ed.). National Center for Voice and Speech.
- Fant, G. (1960). Acoustic Theory of Speech Production. Mouton.