The Voice Range Profile
The voice range profile, also known as the phonetogram or voice field, provides a comprehensive graphical representation of an individual’s vocal capabilities across the dimensions of frequency and intensity. This two-dimensional map plots the maximum and minimum intensity achievable at each fundamental frequency throughout the phonational range, revealing the voice’s dynamic range, frequency extent, and overall functional capacity.
Definition and Concept
The voice range profile quantifies the acoustic output space within which an individual can phonate.
Basic Structure
Two-Dimensional Representation
The phonetogram displays:
- Horizontal axis: fundamental frequency (typically Hz or semitones)
- Vertical axis: sound pressure level (dB SPL)
- Upper contour: maximum intensity at each frequency
- Lower contour: minimum intensity at each frequency
- Enclosed area: total voice field
- Area size indicates vocal capability
Physical Interpretation
The boundaries represent:
- Upper limit: maximum pressure, optimal adduction, vocal tract tuning
- Lower limit: minimum pressure for oscillation (near phonation threshold)
- Frequency extent: lowest to highest achievable F0
- Dynamic range: vertical distance between contours at given frequency
- Total area: integrated measure of vocal capacity
Historical Development
Early Phonetography
The concept emerged from:
- Need for objective voice assessment
- Recognition that voice varies in both pitch and loudness
- Development of instrumentation for SPL measurement
- Clinical demand for quantitative evaluation
- Research into vocal capabilities
Standardization Efforts
Over time, methodology evolved toward:
- Standardized measurement protocols
- Defined microphone placement (30 cm typical)
- Specified acoustic environment requirements
- Normative databases for comparison
- Computer-based analysis systems
Measurement Protocol
Obtaining a reliable voice range profile requires systematic methodology.
Standard Procedure
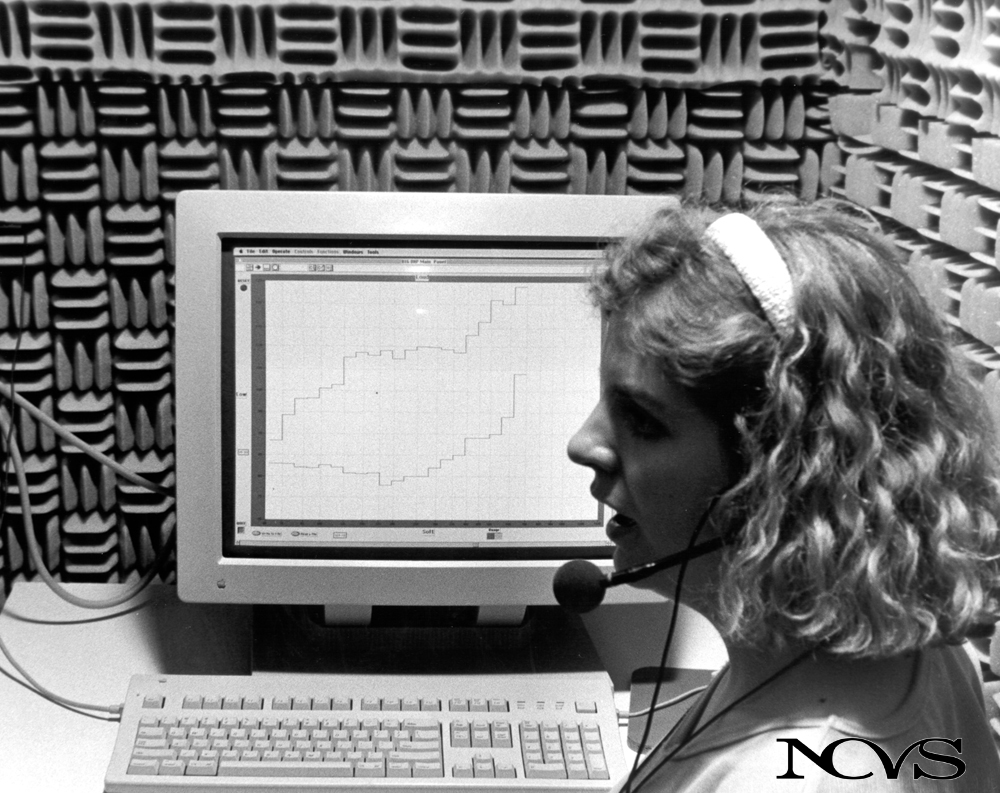 Figure 9.12: Example voice range profiles showing typical phonetogram contours for different voice types and conditions, illustrating frequency extent, dynamic range, and total voice field area that characterize vocal capabilities.
Frequency Selection
Typical protocol:
- Identify comfortable pitch range
- Extend to lowest sustainable note
- Extend to highest sustainable note
- Select measurement points (typically every semitone or 2-3 semitones)
- Total of 20-40 frequency points common
Intensity Variation
At each frequency:
- Begin at comfortable, moderate intensity
- Gradually increase to maximum sustainable loudness
- Record maximum SPL (3-5 second duration)
- Gradually decrease to softest possible phonation
- Record minimum SPL with stable voicing
- Ensure oscillation maintained, not vocal fry or aphonic
Acoustic Measurement
Standard conditions:
- Sound level meter or calibrated microphone
- 30 cm from lips (most common standard)
- Quiet room (background noise < 40 dB SPL)
- Straight-ahead vocal projection
- Standing or seated position (specify consistently)
Phonatory Tasks
Vowel Selection
Most commonly:
- /a/ vowel (maximizes mouth opening, intensity)
- Sustained phonation (3-5 seconds typical)
- Some protocols use /i/ or /u/ for comparison
- Running speech or singing less common
- Standardization within study critical
Register Considerations
Instructions to participant:
- Use any register/voice quality achievable
- Transitions between registers allowed
- Goal is maximum range, not quality
- Document register use when relevant
- Note any voicing difficulties
Quality Control
Reliability Measures
Ensuring valid measurement:
- Demonstrate task before data collection
- Practice trials until participant comfortable
- Repeat entire profile (2-3 times)
- Average or select best performance
- Check for learning effects or fatigue
- Document any irregularities
Common Measurement Errors
Potential problems:
- Microphone distance inconsistent
- Background noise interference
- Participant holds back maximum effort
- Confusion about minimum intensity (vocal fry vs. true phonation)
- Fatigue effects over long protocol
- Poor calibration of equipment
Normal Voice Range Profiles
Phonetograms vary systematically with voice classification, gender, and training.
Adult Voice Types
Female Profiles
Typical characteristics:
- Frequency range: approximately A3 (220 Hz) to C6 (1046 Hz) for trained singers
- Untrained: approximately G3 (196 Hz) to E5 (659 Hz)
- Maximum SPL: 95-110 dB at comfortable mid-range
- Minimum SPL: 50-60 dB
- Dynamic range: 30-50 dB at optimal frequencies
- Area: 1500-3000 semitone-dB for trained singers
Male Profiles
Typical characteristics:
- Frequency range: approximately E2 (82 Hz) to G4 (392 Hz) for trained singers
- Untrained: approximately G2 (98 Hz) to D4 (294 Hz)
- Maximum SPL: 95-115 dB (can exceed females due to larger larynx)
- Minimum SPL: 45-55 dB
- Dynamic range: 30-50 dB at optimal frequencies
- Area: 1500-3500 semitone-dB for trained singers
Contour Characteristics
Upper Contour Shape
Maximum intensity envelope:
- Relatively flat across mid-frequency range
- May increase slightly with rising frequency (to a point)
- Often declines at extreme high frequencies
- Register transitions may show discontinuities
- Individual variation substantial
Lower Contour Shape
Minimum intensity envelope:
- U-shaped or J-shaped curve common
- Lowest values at mid-frequency range
- Rises at low frequencies (approaching vocal fry)
- Rises at high frequencies (approaching falsetto)
- Reflects phonation threshold pressure variation
Dynamic Range Variation
Frequency-dependent patterns:
- Maximum dynamic range at comfortable mid-frequencies
- Reduced range at frequency extremes
- Corresponds to optimal phonatory efficiency
- Individual optimal frequencies identifiable
- Training can expand range
Age Effects
Children
Developmental characteristics:
- Smaller frequency extent than adults
- Higher fundamental frequencies overall
- Lower maximum intensities (smaller larynx)
- Rapid changes during puberty
- Normative data age-specific
Elderly Adults
Age-related changes:
- Reduced frequency range (especially upward)
- Reduced maximum intensity
- Elevated minimum intensity (higher phonation threshold)
- Decreased dynamic range
- Reduced total area
- Individual variation large
Training Effects
Singing Training Impact
Professional singers demonstrate:
- Expanded frequency range (especially upward)
- Increased maximum intensity at most frequencies
- Lower minimum intensity (better control)
- Greater dynamic range throughout
- Larger total voice field area (2-3x untrained)
- More uniform capabilities across range
Voice Training Mechanisms
Training improves phonetogram through:
- Enhanced respiratory control and capacity
- Optimized laryngeal muscle coordination
- Vocal tract adjustments (formant tuning)
- Improved efficiency (lower phonation threshold)
- Greater dynamic control
- Extended comfortable range
Clinical Applications
The voice range profile provides valuable diagnostic and prognostic information.
Diagnostic Uses
Voice Disorder Detection
Pathological phonetograms show:
- Reduced frequency range
- Reduced maximum intensity
- Elevated minimum intensity
- Decreased dynamic range
- Reduced total area
- Irregular contours (missing frequencies)
Specific Disorder Patterns
Different pathologies produce characteristic changes:
- Vocal fold mass lesions: reduced upper contour, irregular shape
- Vocal fold paralysis: reduced maximum intensity, elevated minimum
- Muscle tension dysphonia: reduced dynamic range, elevated lower contour
- Vocal fold atrophy: elevated minimum intensity, reduced maximum
- Presbylarynx: generalized reduction in area and range
Severity Assessment
Quantitative Metrics
Objective measures derived:
- Total area (semitone-dB)
- Maximum frequency extent (semitones or Hz)
- Average dynamic range (dB)
- Maximum SPL achieved
- Percentage of expected normative area
- Deviation from age/gender norms
Functional Impact
Phonetogram reduction correlates with:
- Vocal effort and fatigue
- Communication handicap
- Professional voice limitations
- Reduced expressive capability
- Quality of life impact
Treatment Monitoring
Therapy Outcomes
Voice range profile tracks improvement:
- Expansion of frequency range
- Increase in maximum intensity
- Decrease in minimum intensity (better control)
- Enlarged dynamic range
- Increased total area
- Restoration toward normal contours
Objective Documentation
Advantages for outcome measurement:
- Quantitative change metrics
- Pre/post treatment comparison
- Documents specific improvements
- Motivates patient adherence
- Supports efficacy research
- Insurance documentation
Surgical Planning and Outcomes
Preoperative Assessment
Phonetogram before surgery:
- Documents baseline capabilities
- Identifies specific deficits
- Helps set realistic expectations
- Provides objective comparison standard
- Guides surgical approach selection
Postoperative Evaluation
Follow-up phonetography:
- Documents functional outcome
- Identifies residual deficits
- Guides rehabilitation needs
- Compares to surgical goals
- Validates technique effectiveness
Performance Applications
Voice range profiles inform performance optimization and training.
Repertoire Selection
Matching Voice to Music
Phonetogram guides:
- Identification of comfortable frequency range
- Assessment of required dynamic range
- Evaluation of extreme note capabilities
- Recognition of optimal performance range
- Selection of suitable repertoire
Role Assignment
In ensemble settings:
- Soprano, alto, tenor, bass classification
- Solo vs. ensemble suitability
- Specific role capabilities
- Limitations to acknowledge
- Strengths to exploit
Training Goals
Systematic Development
Using phonetogram to guide training:
- Identify specific limitations (range, dynamics, particular frequencies)
- Set measurable improvement goals
- Track progress objectively
- Adjust training focus as needed
- Document skill development
Technique Refinement
Targeting specific regions:
- Expand frequency range systematically
- Improve dynamic control at challenging frequencies
- Smooth register transitions (eliminate contour irregularities)
- Balance capabilities across range
- Optimize efficiency at all frequencies
Performance Monitoring
Tracking Vocal Condition
Regular phonetography can:
- Detect early signs of fatigue or dysfunction
- Monitor effects of intense performance schedule
- Document seasonal or cyclic variations
- Identify need for rest or intervention
- Optimize training and performance timing
Preventing Injury
Early detection enables:
- Modifications before serious damage
- Strategic rest periods
- Adjustment of performance demands
- Targeted rehabilitation
- Maintenance of long-term vocal health
Phonetogram Variants and Extensions
Several variations of the basic voice range profile have been developed.
Speaking Voice Profile
Speech-Specific Assessment
Modified protocol:
- Use of running speech or standardized text
- Natural prosodic variation captured
- Reflects functional communication capabilities
- Different from sustained phonation profile
- More ecologically valid for some purposes
Clinical Relevance
- Better represents daily voice use
- Identifies functional limitations
- Guides communication-focused therapy
- Documents real-world improvement
- Complements sustained phonation data
Physiological Frequency Range of Phonation
Extended Frequency Range
Captures broader capabilities:
- Includes vocal fry and whistle register
- Documents complete frequency extent
- May exceed typical phonetogram range
- Clinical and research applications
- Individual variation extreme
Dynamic Voice Range Profile
Time-Varying Analysis
More sophisticated approaches:
- Continuous intensity variation over time
- Frequency glides rather than discrete pitches
- Captures transition capabilities
- More complex analysis
- Research tool primarily
Computer-Based Systems
Modern phonetography increasingly relies on automated systems.
Software Capabilities
Automated Data Collection
Current systems offer:
- Real-time frequency and intensity tracking
- Visual feedback during measurement
- Automated contour detection
- Normative comparison databases
- Standardized reporting formats
- Integration with clinical records
Analysis Features
Advanced computation:
- Automatic area calculation
- Statistical comparison to norms
- Change detection over time
- Multiple profile overlay
- Export to research databases
- Graphical presentation options
Biofeedback Applications
Training with Visual Feedback
Real-time display enables:
- Participant sees their phonetogram during production
- Targets specific regions for expansion
- Immediate reinforcement of improvements
- Gamification of training tasks
- Enhanced learning efficiency
- Motivation through visible progress
Limitations and Considerations
Despite utility, voice range profile has limitations.
Methodological Issues
Protocol Variability
Challenges include:
- Multiple protocols in use (hinders comparison)
- Microphone distance affects measurements
- Vowel choice influences results
- Instructions to participant critical
- Within-subject variability substantial
- Between-session reliability requires careful methodology
Effort and Motivation
Phonetogram depends on:
- Maximum voluntary effort
- Willingness to produce loud voice
- Comfort with task requirements
- Psychological factors
- Fatigue state
- Practice effects
Interpretation Challenges
Individual Variation
Normal variation is large:
- Wide range of “normal” phonetograms
- Voice classification influences expectations
- Training history critical
- Age effects substantial
- Single measurement may not represent capability
- Context-specific norms often needed
Clinical Judgment Required
Phonetogram interpretation requires:
- Understanding of normal variation
- Knowledge of pathophysiology
- Integration with other assessments
- Clinical context consideration
- Experience with measurement artifacts
- Appropriate norm selection
Summary
The voice range profile (phonetogram) provides a comprehensive two-dimensional representation of vocal capabilities, plotting maximum and minimum intensity achievable across the entire fundamental frequency range with total voice field area reflecting integrated capacity. Standard measurement protocols involve sustained vowel phonation (typically /a/) at multiple frequencies with sound pressure level measured at 30 cm distance, capturing upper contour (maximum intensity), lower contour (minimum intensity reflecting phonation threshold variation), and the enclosed dynamic range at each frequency.
Normal phonetograms vary systematically with gender, age, and training, with trained singers demonstrating 2-3 times larger voice field area, expanded frequency range, increased maximum intensity, decreased minimum intensity, and greater dynamic range compared to untrained speakers. Clinical applications include diagnostic detection of voice disorders through reduced area and irregular contours, severity assessment using quantitative metrics, treatment outcome monitoring with objective pre/post comparison, and surgical planning and evaluation.
Performance applications involve repertoire selection matched to individual capabilities, training goal setting with measurable targets for range and dynamic expansion, and performance monitoring to detect early signs of fatigue or dysfunction. The U-shaped or J-shaped lower contour reflects frequency-dependent phonation threshold pressure variation with lowest values at mid-frequency range, while upper contour shows relatively flat maximum intensity across comfortable range with possible decline at frequency extremes. Computer-based systems enable automated data collection with real-time feedback, normative comparisons, and standardized reporting, though interpretation requires clinical judgment due to substantial individual variation, methodological factors affecting reliability, and dependence on participant effort and motivation.
Key Takeaways
- ✅ Voice range profile maps frequency-intensity space with upper/lower contours defining maximum/minimum capabilities and enclosed area
- ✅ Standard protocol uses sustained /a/ vowel at multiple frequencies with SPL measured at 30 cm distance
- ✅ Normal phonetograms show U-shaped lower contour (reflecting phonation threshold variation) and relatively flat upper contour
- ✅ Trained singers demonstrate 2-3x larger voice field, expanded frequency range, and greater dynamic control than untrained
- ✅ Clinical applications: disorder detection (reduced area, irregular contours), severity assessment, treatment monitoring, surgical outcomes
- ✅ Pathological patterns show reduced frequency range, decreased maximum intensity, elevated minimum intensity, reduced dynamic range
- ✅ Performance applications include repertoire selection, training goal setting, and vocal condition monitoring
- ✅ Interpretation requires clinical judgment due to substantial normal variation, methodological factors, and effort dependence
Related Topics
- Phonation Threshold Pressure
- Combined Intensity Changes
- Dependence of Glottal Source Power on Lung Pressure and F0
- Formant Tuning
- Vocal Registers
Further Reading
- Schutte, H. K., & Seidner, W. (1983). Recommendation by the Union of European Phoniatricians (UEP): Standardizing voice area measurement/phonetography. Folia Phoniatrica, 35, 286-288.
- Pabon, J. P., & Plomp, R. (1988). Automatic phonetogram recording supplemented with acoustical voice-quality parameters. Journal of Speech and Hearing Research, 31, 710-722.
- Sulter, A. M., Schutte, H. K., & Miller, D. G. (1995). Differences in phonetogram features between male and female subjects with and without vocal training. Journal of Voice, 9(4), 363-377.
- Siupsinskiene, N., & Lycke, H. (2011). Effects of vocal training on singing and speaking voice characteristics in vocally healthy adults and children. Journal of Voice, 25(4), 177-189.
- Heylen, L., Wuyts, F. L., Mertens, F., De Bodt, M., & Van de Heyning, P. H. (2002). Normative voice range profiles of male and female professional voice users. Journal of Voice, 16(1), 1-7.