Phonation Threshold Pressure
Phonation threshold pressure (PTP) represents the minimum subglottal pressure required to initiate and sustain vocal fold oscillation. This critical parameter reflects the complex interaction between aerodynamic forces, tissue biomechanics, and glottal geometry, providing valuable insights into vocal fold function, efficiency of phonation, and the presence of pathology.
Definition and Concept
Phonation threshold pressure demarcates the boundary between phonatory and non-phonatory states.
Basic Definition
Threshold Condition
- Minimum pressure below vocal folds needed for oscillation onset
- Balance point where aerodynamic forces overcome tissue resistance
- Typically 3-5 cm H₂O for normal modal phonation
- Varies with pitch, vocal fold configuration, and tissue properties
- Lower PTP indicates more efficient phonation
Physical Interpretation
- Below PTP: folds remain stationary despite airflow
- At PTP: oscillation just begins (marginal stability)
- Above PTP: sustained oscillation occurs
- Higher pressure increases amplitude and intensity
- PTP represents onset of voice production
Relationship to Oscillation Theory
Myoelastic-Aerodynamic Theory
- Oscillation requires balance of forces
- Bernoulli force pulls folds together
- Tissue elasticity restores folds to rest
- Inertia and viscosity affect dynamics
- PTP is minimum pressure for force balance
Energy Balance
- Aerodynamic energy input must exceed tissue energy losses
- Viscous damping dissipates energy
- Collision losses at closure
- Radiation losses
- PTP occurs when input equals losses
Biomechanical Determinants
Multiple factors influence the magnitude of phonation threshold pressure.
Tissue Stiffness
Elastic Properties
- Stiffer tissues require higher PTP
- Young’s modulus determines restoring forces
- Increased tension raises PTP
- Cricothyroid activation increases stiffness and PTP
- Age-related stiffening elevates PTP
Viscosity
- Viscous component resists motion
- Higher viscosity increases energy dissipation
- Raises PTP by increasing damping
- Varies with tissue hydration
- Inflammation increases viscosity and PTP
Layer Structure
- Cover-body organization affects PTP
- Loose cover (vocal ligament/mucosa) lowers PTP
- Stiff cover increases PTP
- Scarring disrupts layer structure and raises PTP
- Optimal layering minimizes PTP
Vocal Fold Geometry
Thickness
- Thicker folds generally require higher PTP
- More tissue mass to oscillate
- Greater inertia to overcome
- Males typically higher PTP than females
- Edema increases thickness and PTP
Length
- Longer folds have lower PTP (at constant tension)
- Greater surface area for aerodynamic forces
- Lower tension per unit length
- Elongation by cricothyroid lowers PTP
- Until stiffening effect dominates
Pre-phonatory Glottal Configuration
- Small glottal gap lowers PTP
- Allows Bernoulli forces to act immediately
- Large gap increases PTP substantially
- Adduction level critical
- Optimal configuration minimizes PTP
Glottal Configuration
Adduction Level
- Light adduction: high PTP due to insufficient coupling
- Moderate adduction: optimal PTP (lowest value)
- Heavy adduction: increased PTP due to high stiffness
- Inverted-U relationship
- Clinical implications for voice therapy
Vertical Phase Difference
- Lower margin leading creates favorable phase
- Facilitates energy transfer from airflow
- Lowers PTP
- Upper margin leading increases PTP
- Convergent angle during closure optimal
Frequency Dependence
Phonation threshold pressure varies systematically with fundamental frequency.
Theoretical Relationship
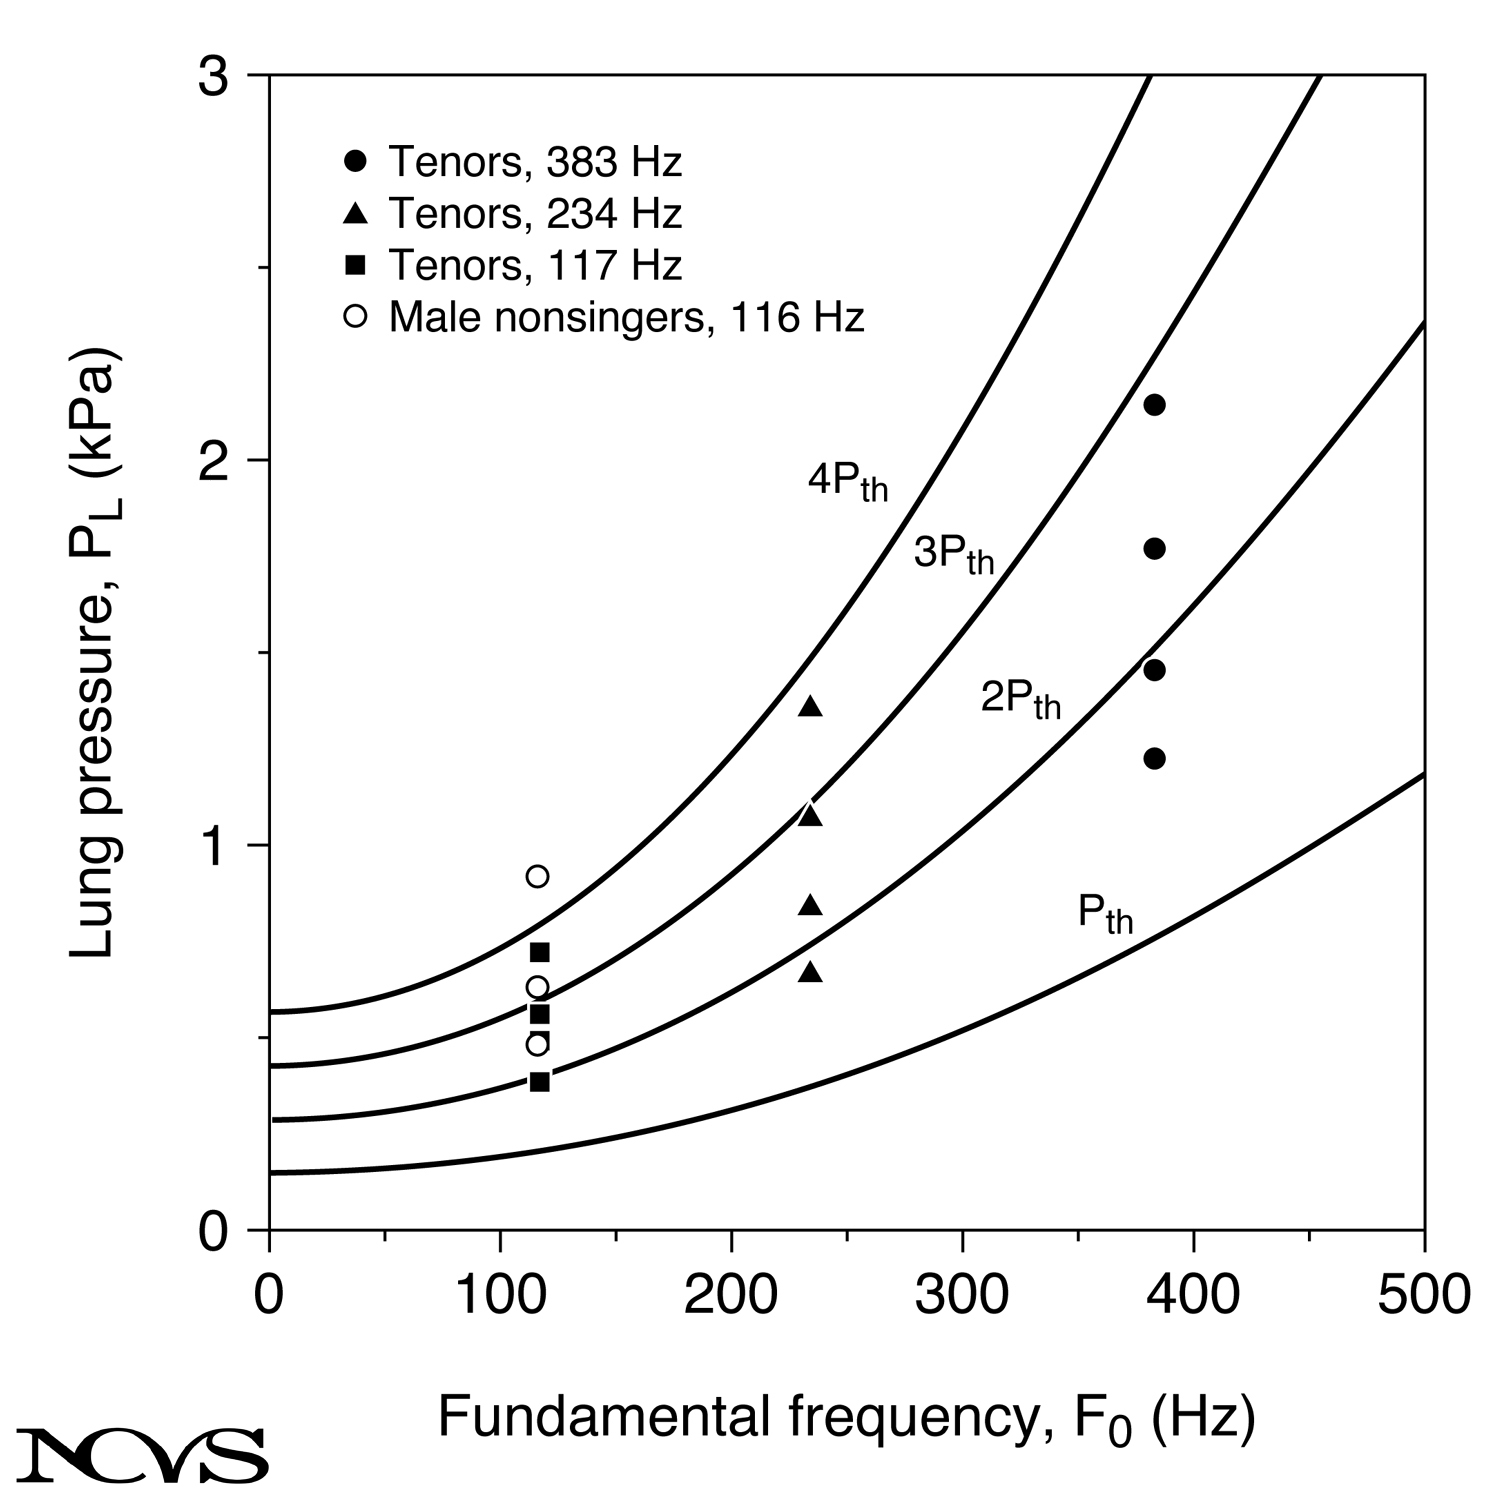 Figure 9.6: Phonation threshold pressure as function of fundamental frequency, showing threshold pressure rising with fundamental frequency—slowly through the speaking range and steeply toward the top of the range.
General Pattern
- PTP rises with F0; Titze’s (1992) model gives PTP ≈ 0.14 + 0.06 (F₀/F₀ₙ)² kPa, where F₀ₙ is the normal speaking frequency
- Lowest values (about 0.2 kPa, or 2 cm H₂O) in the lower-to-middle part of the range, near comfortable speaking pitch
- Slow increase through the speaking range, steep increase toward the top of the range
- Some studies report a slight elevation at the very bottom of the range, where the folds are slack and thick, but there is no pronounced U shape
- Individual variation in curve shape
Why Low Pitch Is Cheap
- Long, lax folds with a mobile cover
- Low tissue stiffness and a large mucosal wave transfer energy efficiently
- Viscous losses are small because the vibration rate is low
High-Frequency Increase
- Tension increases with F0
- Stiffening raises tissue resistance
- Shorter cycles reduce energy transfer time
- Viscous losses proportional to frequency
- Fundamental frequency limit approached
Practical Implications
Optimal Phonatory Frequency
- Frequency range with lowest PTP
- Most efficient voice production
- Corresponds to habitual speaking pitch range
- Individual variation significant
- Training can shift optimal range
Clinical Assessment
- PTP measured across pitch range
- Abnormal curve shape indicates dysfunction
- Elevated PTP throughout range: tissue pathology
- Asymmetric curve: possible structural lesion
- Can guide treatment planning
Measurement Techniques
Accurate PTP measurement requires careful methodology.
Direct Pressure Measurement
Invasive Methods
- Tracheal puncture with pressure transducer
- Gold standard for accuracy
- Research setting only
- Not clinically practical
- Provides true subglottal pressure
Semi-Invasive Methods
- Esophageal balloon catheter
- Approximates subglottal pressure
- Better tolerated than tracheal puncture
- Some inaccuracy from esophageal compliance
- Used in research and specialized clinical settings
Indirect Estimation Methods
Intraoral Pressure Method
- Estimate during /p/ production
- Intraoral pressure approximates subglottal
- During occlusion, pressures equalize
- Simple and non-invasive
- Requires careful technique
Protocol
- Subject produces /pi/ syllables at decreasing intensity
- Measure intraoral pressure during /p/
- Listen for voice onset during /i/
- Lowest pressure with voicing = PTP estimate
- Repeat multiple times for reliability
Airflow Interruption Method
- Brief interruption of flow during phonation
- Pressure measurement during closure
- Estimates subglottal pressure
- Can estimate PTP from pressure-flow relationship
- Requires specialized equipment
Practical Considerations
Vocal Task Selection
- Sustained vowel most common
- Comfortable pitch and intensity
- Must be repeatable
- Running speech more variable
- Standardization important
Multiple Measurements
- PTP varies trial-to-trial
- Average of 3-5 measurements typical
- Coefficient of variation indicates reliability
- Within-session typically consistent
- Between-session more variable
Clinical Significance
PTP provides valuable diagnostic and prognostic information.
Normal Values
Typical Ranges
- Adult males: 3-5 cm H₂O (modal voice, comfortable pitch)
- Adult females: 2-4 cm H₂O
- Children: 2-3 cm H₂O
- Falsetto: 1-2 cm H₂O
- Pressed voice: 5-10 cm H₂O or higher
Factors Affecting Normal Values
- Age: increases with aging
- Gender: males slightly higher
- Vocal training: trained singers often lower
- Hydration: dehydration elevates PTP
- Time of day: may vary with vocal use/fatigue
Pathological Patterns
Elevated PTP
Conditions causing increased PTP:
- Vocal fold scarring or stiffness
- Inflammation (acute laryngitis)
- Vocal fold mass lesions (nodules, polyps)
- Sulcus vocalis
- Aging-related tissue changes
- Dehydration
Clinical Interpretation
- Higher threshold requires more effort
- Reduced vocal efficiency
- Voice fatigue more likely
- May limit dynamic range
- Indicates tissue dysfunction
Reduced PTP
Conditions causing decreased PTP:
- Hypoadduction (glottal incompetence)
- Vocal fold atrophy
- Sometimes in early stages of superior laryngeal nerve paralysis
- Optimal adduction without excessive tension
- Trained singers (in some cases)
Clinical Interpretation
- May indicate insufficient closure
- But can also reflect optimal configuration
- Context-dependent interpretation
- Must consider with other measures
- Low PTP alone not necessarily pathological
Prognostic Value
Treatment Monitoring
- Track PTP changes with therapy
- Successful treatment typically lowers PTP
- Documents improved efficiency
- Objective outcome measure
- Useful for research studies
Surgical Outcomes
- Medialization procedures should lower PTP
- Increased PTP post-surgery may indicate excessive tension
- Can predict functional outcome
- Guides surgical technique refinement
- Useful for comparing procedures
Therapeutic Implications
Understanding PTP guides voice therapy approaches.
Strategies to Lower PTP
Optimal Hydration
- Systemic hydration maintains tissue pliability
- Surface hydration via nebulization
- Reduces tissue viscosity
- Can lower PTP by 10-20%
- First-line intervention for many voice disorders
Optimal Adduction Training
- Find configuration with lowest PTP
- Often moderate adduction
- Semi-occluded vocal tract exercises
- Resonant voice techniques
- Voice function exercises
Reducing Excessive Tension
- Relaxation techniques
- Laryngeal massage
- Breathing exercises
- Can significantly lower PTP
- Improves vocal efficiency
Improving Mucosal Wave
- Focus on free oscillation
- Avoid pressed phonation
- Flow phonation exercises
- Facilitates energy transfer
- Lowers PTP through improved biomechanics
Clinical Decision-Making
When to Focus on PTP
- High PTP with vocal effort/fatigue
- Reduced dynamic range
- Evidence of hyperfunction
- Post-surgical rehabilitation
- Efficiency-based therapy approach
Complementary Measures
- Maximum phonation time
- Frequency-intensity range
- Acoustic measures (jitter, shimmer, HNR)
- Perceptual voice quality
- Patient-reported outcomes
Research Applications
PTP serves as important research parameter.
Computational Modeling
Model Validation
- Predicted PTP compared with measured
- Tests accuracy of biomechanical models
- Refines tissue property estimates
- Improves understanding of oscillation onset
- Guides model development
Parametric Studies
- Vary model parameters systematically
- Observe effects on predicted PTP
- Identify critical factors
- Generate testable hypotheses
- Inform clinical understanding
Drug and Treatment Studies
Quantitative Outcomes
- PTP as objective treatment outcome
- More sensitive than some acoustic measures
- Documents mechanism of action
- Useful for medication trials
- Guides therapeutic decision-making
Comparative Effectiveness
- Compare therapy approaches
- Voice rest effects
- Hydration interventions
- Different voice therapy techniques
- Surgical technique comparisons
Summary
Phonation threshold pressure represents the minimum subglottal pressure required for vocal fold oscillation, typically 3-5 cm H₂O for modal voice, reflecting the balance between aerodynamic forces and tissue biomechanics. PTP is determined by vocal fold stiffness (elastic and viscous properties), geometry (thickness, length, glottal configuration), and adduction level, with an inverted-U relationship between adduction and PTP showing optimal efficiency at moderate adduction. PTP exhibits characteristic U-shaped frequency dependence with lowest values in mid-frequency range and increases at both low and high frequencies due to different physical mechanisms.
Clinical measurement employs either direct pressure measurement (invasive, research setting) or indirect estimation (intraoral pressure during /p/ production, clinically practical), with normal values ranging from 2-4 cm H₂O (females) to 3-5 cm H₂O (males) in modal voice. Elevated PTP indicates increased tissue stiffness, mass, or suboptimal configuration, occurring in conditions such as vocal fold scarring, inflammation, lesions, or dehydration, while reduced PTP may indicate either hypoadduction or optimal efficient phonation depending on context.
Therapeutic strategies to lower PTP include optimizing hydration, training appropriate adduction levels, reducing excessive tension, and improving mucosal wave mechanics through specific exercises. PTP serves as valuable objective outcome measure for monitoring treatment effectiveness, predicting surgical outcomes, and guiding clinical decision-making, while research applications include computational model validation and comparative effectiveness studies of interventions. Understanding PTP mechanics and measurement enables more sophisticated analysis of voice production efficiency and more targeted therapeutic interventions.
Key Takeaways
- ✅ PTP is minimum subglottal pressure for oscillation onset, typically 3-5 cm H₂O, reflecting aerodynamic-tissue force balance
- ✅ Determined by tissue stiffness (elastic and viscous), vocal fold geometry (thickness, length), and glottal configuration
- ✅ Shows inverted-U relationship with adduction: optimal at moderate adduction, higher with too little or too much
- ✅ Rises with fundamental frequency, roughly quadratically above the speaking range; lowest near comfortable speaking pitch
- ✅ Clinically measured via intraoral pressure during /p/ production at threshold of phonation onset
- ✅ Elevated PTP indicates pathology (scarring, inflammation, lesions, dehydration); reduced PTP may indicate hypoadduction or optimal efficiency
- ✅ Therapeutic strategies lower PTP through hydration, optimal adduction training, tension reduction, and improved mucosal wave
- ✅ Serves as objective outcome measure for therapy effectiveness, surgical outcomes, and research studies
Related Topics
- Dependence of Glottal Source Power on Adduction
- Dependence of Glottal Source Power on Lung Pressure and F0
- Effect of Lung Pressure on F0
- Mechanisms for Self-Sustained Oscillation
- Vocal Efficiency
Further Reading
- Titze, I. R. (1988). The physics of small-amplitude oscillation of the vocal folds. Journal of the Acoustical Society of America, 83, 1536-1552.
- Titze, I. R. (1992). Phonation threshold pressure: A missing link in glottal aerodynamics. Journal of the Acoustical Society of America, 91, 2926-2935.
- Chan, R. W., & Titze, I. R. (2006). Dependence of phonation threshold pressure on vocal tract acoustics and vocal fold tissue mechanics. Journal of the Acoustical Society of America, 119, 2351-2362.
- Verdolini-Marston, K., Titze, I. R., & Druker, D. G. (1990). Changes in phonation threshold pressure with induced conditions of hydration. Journal of Voice, 4(2), 142-151.
- Solomon, N. P., & DiMattia, M. S. (2000). Effects of a vocally fatiguing task and systemic hydration on phonation threshold pressure. Journal of Voice, 14(3), 341-362.