Glottal Efficiency
Glottal efficiency quantifies the effectiveness of energy conversion during phonation, expressing the ratio of radiated acoustic power to aerodynamic power supplied by the respiratory system. This fundamental measure provides insight into how well the vocal mechanism transforms lung pressure and airflow into sound, revealing the inherently low efficiency of voice production compared to engineered sound sources while offering valuable clinical and pedagogical information about vocal function and optimization strategies.
Definition and Concept
Glottal efficiency represents the central energy conversion metric in voice production.
Basic Definition
Efficiency Ratio
Glottal efficiency (η) is defined as:
η = Acoustic Power Output / Aerodynamic Power Input
Where:
- Acoustic power: radiated sound power (watts)
- Aerodynamic power: subglottal pressure × mean glottal airflow (watts)
- Efficiency expressed as decimal (0.001) or percentage (0.1%)
- Dimensionless ratio
- Always less than 1 (100%)
Physical Interpretation
The efficiency reveals:
- What fraction of input energy becomes sound
- How much energy is “lost” to other processes
- Effectiveness of glottal oscillation mechanism
- Quality of impedance matching
- Overall system performance
- Comparison benchmark across conditions
Typical Magnitude
Remarkably Low Efficiency
Voice production demonstrates:
- Typical glottal efficiency: 0.0001 to 0.01 (0.01% to 1%)
- Mean conversational speech: approximately 0.001 (0.1%)
- Loud speaking: up to 0.01 (1%)
- Singing: 0.002-0.02 (0.2% to 2%)
- Shouting: may reach 0.02-0.03 (2-3%)
- 95-99.99% of input energy “lost”
Comparison to Other Sound Sources
Relative to engineered systems:
- Voice: 0.01-1% efficient
- Loudspeakers: 1-10% efficient
- Musical instruments: 0.1-10% efficient (varies widely)
- All acoustically inefficient compared to electronics
- But sufficient for biological communication
- Evolution optimized for adequacy, not maximum efficiency
Measurement Methodology
Determining glottal efficiency requires careful measurement of both power components.
Aerodynamic Power Measurement
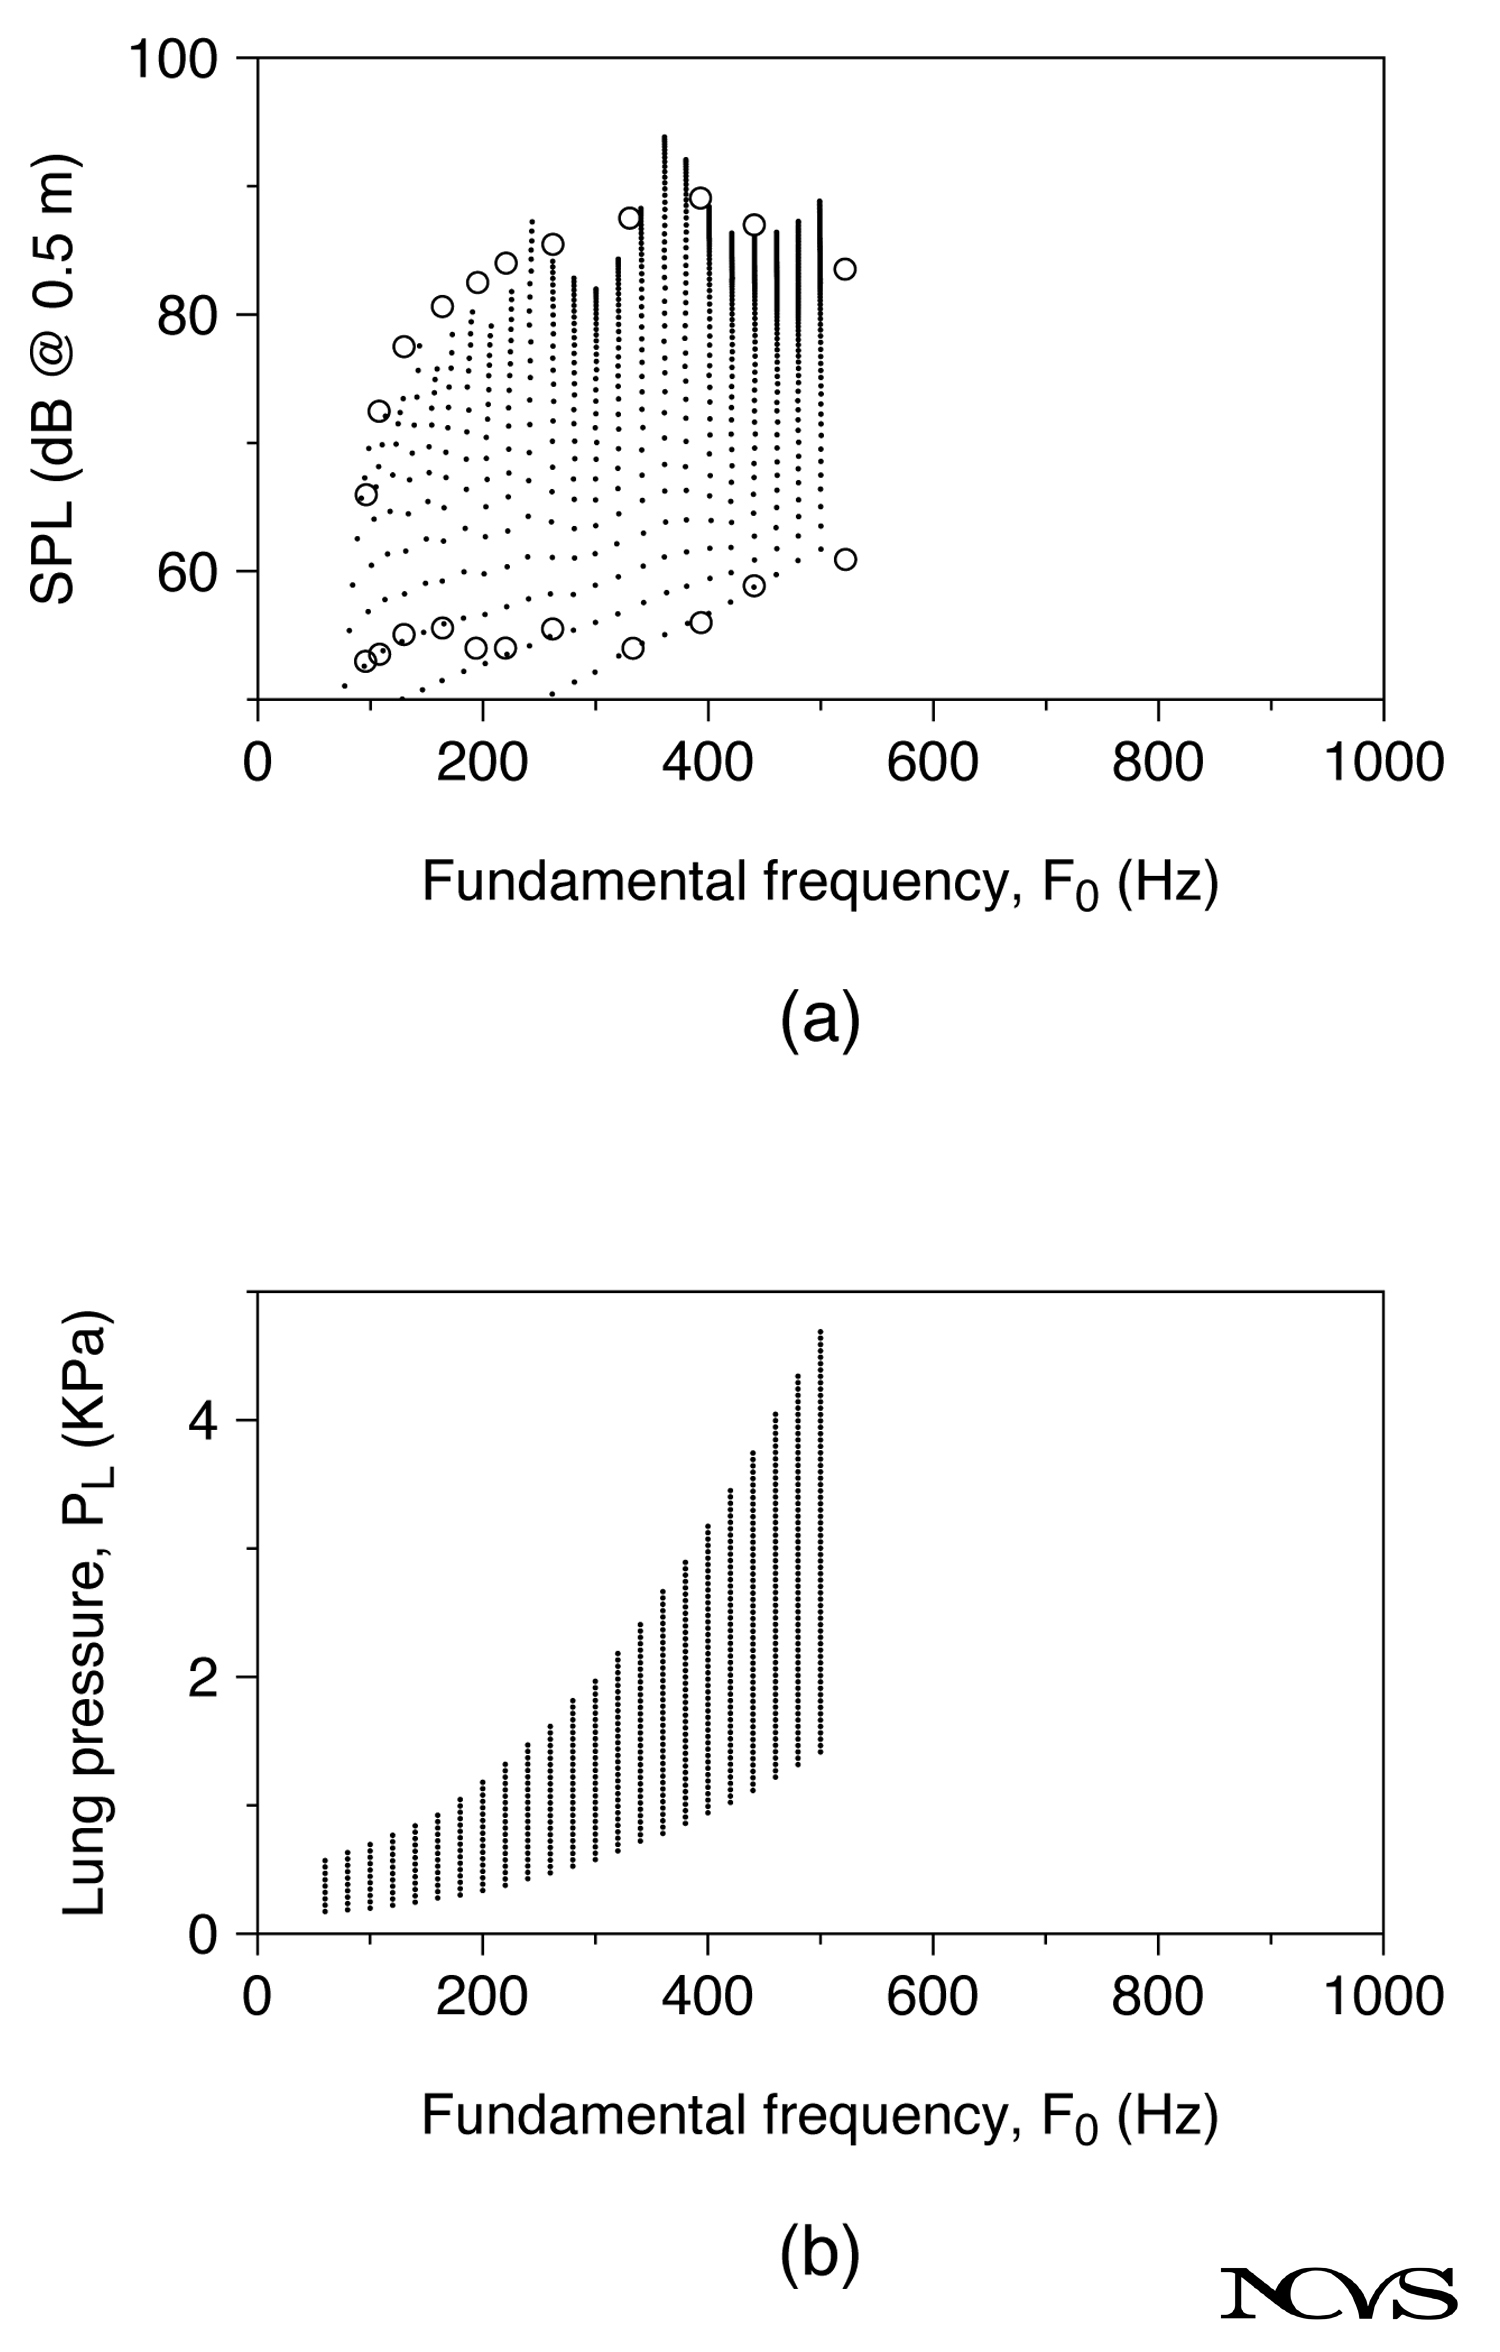 Figure 9.14: Schematic diagram showing measurement setup for determining glottal efficiency through simultaneous assessment of subglottal pressure, glottal airflow, and radiated acoustic intensity, illustrating the instrumentation and calculations required for efficiency determination.
Subglottal Pressure
Measurement approaches:
- Tracheal puncture (invasive, research only)
- Esophageal balloon catheter (semi-invasive)
- Intraoral pressure during /p/ (non-invasive estimate)
- Typical values: 5-15 cm H₂O conversational speech
- 20-40 cm H₂O loud speech/singing
- Pressure units converted to Pascals for calculation
Glottal Airflow
Measurement methods:
- Pneumotachograph with face mask
- Inverse filtering to estimate glottal flow from oral flow
- Typical values: 100-200 ml/s conversational speech
- Up to 500+ ml/s loud phonation
- Mean flow across phonatory cycle used
- Flow units converted to m³/s for calculation
Calculating Aerodynamic Power
Aerodynamic power (Pa) computed as:
Pa = Ps × U
Where:
- Ps = subglottal pressure (Pascals)
- U = mean glottal airflow (m³/s)
- Result in watts
- Example: 800 Pa × 0.0002 m³/s = 0.16 watts
Acoustic Power Measurement
Sound Intensity
Direct measurement challenges:
- Sound intensity in all directions needed
- Microphone placement affects measurement
- Free-field conditions required
- Distance from source matters
- Direction-dependent radiation pattern
Standard Measurement Protocol
Typical approach:
- Microphone 30 cm from lips
- Measure sound pressure level (SPL)
- Assume approximate radiation pattern
- Calculate acoustic power from SPL and distance
- Apply radiation efficiency correction
- Account for frequency-dependent radiation
Acoustic Power Calculation
From SPL measurement:
Wa = I × A
Where:
- I = sound intensity (W/m²)
- A = effective radiating area (m²)
- Calculated from SPL and distance
- Typical values: 10-100 microwatts conversational speech
- Up to 1-10 milliwatts loud speech/singing
Calculation Example
Typical Conversational Speech
Given measurements:
- Subglottal pressure: 8 cm H₂O = 784 Pa
- Mean glottal flow: 150 ml/s = 0.00015 m³/s
- SPL at 30 cm: 65 dB SPL
- Acoustic power (estimated): 20 microwatts = 0.00002 watts
Calculations:
- Aerodynamic power: 784 × 0.00015 = 0.118 watts
- Acoustic power: 0.00002 watts
- Efficiency: 0.00002 / 0.118 = 0.00017 = 0.017%
Factors Affecting Glottal Efficiency
Efficiency varies systematically with phonatory adjustments.
Intensity Effects
Efficiency Increases with Loudness
General pattern:
- Soft phonation: very low efficiency (0.01% or less)
- Moderate intensity: intermediate efficiency (0.1%)
- Loud phonation: highest efficiency (0.5-2%)
- Acoustic power increases faster than aerodynamic power
- Optimal adduction at higher intensities
- Better impedance matching in loud voice
Mechanism
Why efficiency improves with loudness:
- Stronger glottal closure
- Higher alternating flow component
- Better acoustic coupling
- More efficient oscillation mode
- Reduced DC flow waste
- Optimal tissue collision
Pitch Effects
U-Shaped Efficiency-Frequency Relationship
Efficiency varies with F0:
- Low pitches: moderate efficiency
- Mid-range frequencies: maximum efficiency
- High pitches: reduced efficiency (until falsetto)
- Falsetto: very low efficiency
- Pattern mirrors phonation threshold pressure
- Optimal frequencies most efficient
Mechanism
Physical basis:
- Mid-range: optimal tissue tension and mass balance
- Low F0: larger amplitude reduces efficiency
- High F0: increased tension increases energy cost
- Falsetto: incomplete closure wastes airflow
- Individual optimal frequencies vary
- Training can shift optimal range
Adduction Level
Inverted-U Relationship
Efficiency peaks at moderate adduction:
- Light adduction: low efficiency (air leakage, incomplete closure)
- Moderate adduction: maximum efficiency (optimal coupling)
- Heavy adduction: reduced efficiency (excessive stiffness, energy cost)
- Pressed voice: very inefficient despite loudness
- Breathy voice: inefficient due to DC flow
- Balance critical
Vocal Register
Register-Dependent Efficiency
Different registers show distinct efficiency:
- Chest voice: relatively high efficiency (optimal closure)
- Mixed voice: intermediate to high efficiency
- Head voice: moderate efficiency
- Falsetto: low efficiency (incomplete closure)
- Vocal fry: very low efficiency (irregular oscillation)
- Modal voice generally most efficient
Vocal Tract Configuration
Resonance Effects
Vocal tract influences efficiency:
- Formant tuning increases radiated power without increasing aerodynamic input
- Improves overall efficiency substantially
- Singer’s formant enhances efficiency
- Optimal impedance loading improves glottal oscillation
- Inertive reactance at glottis matters
- Vocal tract-source interaction complex
Efficiency Across Voice Types and Populations
Systematic variation exists across individuals and groups.
Gender Differences
Male vs. Female Efficiency
General patterns:
- Males: slightly higher typical efficiency
- Females: slightly lower typical efficiency
- Differences modest (factor of 1.5-2x)
- Overlapping distributions
- Larger larynx may confer advantage
- More harmonics through singer’s formant region (males)
Training Effects
Singers vs. Non-Singers
Professional voice users demonstrate:
- 2-4x higher efficiency than untrained speakers
- Better across all frequencies and intensities
- More consistent efficiency
- Optimal adduction patterns
- Superior vocal tract configurations
- Learned optimization strategies
Mechanisms of Training
Training improves efficiency through:
- Optimal glottal configuration
- Improved respiratory-phonatory coordination
- Better vocal tract tuning
- Reduced unnecessary tension
- Enhanced acoustic coupling
- More efficient oscillation patterns
Age Effects
Developmental and Aging Changes
Efficiency varies across lifespan:
- Children: relatively low efficiency (developing coordination)
- Young adults: peak efficiency potential
- Aging: gradual efficiency decline
- Vocal fold atrophy reduces efficiency
- Increased phonation threshold pressure
- Compensation strategies may help
Pathological Conditions
Disorder-Specific Patterns
Voice disorders affect efficiency:
- Vocal fold paralysis: severely reduced efficiency
- Mass lesions: reduced efficiency
- Muscle tension dysphonia: may have low or normal efficiency
- Presbylarynx: reduced efficiency
- Scarring: markedly reduced efficiency
- Efficiency metric aids diagnosis
Clinical Applications
Glottal efficiency measurement provides valuable clinical information.
Diagnostic Value
Efficiency as Dysfunction Indicator
Abnormal efficiency suggests:
- Inadequate glottal closure
- Inappropriate adduction patterns
- Suboptimal coordination
- Pathological tissue changes
- Inefficient technique
- Quantifiable deficit
Comparison to Norms
Clinical interpretation:
- Age and gender-specific norms
- Training status consideration
- Severity indicated by degree of deviation
- Pattern across pitch/loudness informative
- Helps localize dysfunction
- Guides treatment approach
Therapy Monitoring
Outcome Measurement
Efficiency tracks improvement:
- Quantifiable change with treatment
- Objective documentation
- Motivates patient adherence
- Validates therapeutic approach
- Demonstrates functional gains
- Supports clinical decision-making
Treatment Goals
Therapy targets:
- Improving efficiency toward normal range
- Reducing excessive aerodynamic power
- Optimizing glottal configuration
- Enhancing acoustic output
- Balancing effort and result
- Sustainable voice production
Biofeedback Applications
Real-Time Efficiency Display
Modern technology enables:
- Visual display of efficiency during phonation
- Immediate feedback for adjustments
- Learning optimal configurations
- Motivation through visible progress
- Accelerated skill development
- Home practice support
Relationship to Other Measures
Efficiency correlates with various vocal parameters.
Maximum Phonation Time
Efficiency-MPT Relationship
Higher efficiency enables:
- Longer sustained phonation
- Less airflow waste
- Extended speech phrases
- Reduced breath frequency
- Important for professional voice users
- Quality of life impact
Voice Quality
Perceptual Correlates
Efficiency relates to:
- Pressed voice: moderate efficiency but high effort
- Breathy voice: low efficiency due to air waste
- Resonant voice: high efficiency
- Normal voice: mid-range efficiency
- Harsh voice: variable efficiency
- Efficiency alone insufficient for quality judgment
Vocal Effort and Fatigue
Effort-Efficiency Trade-Off
Low efficiency implies:
- Higher respiratory effort required
- Greater muscular work
- Faster onset of fatigue
- Unsustainable voice production
- Compensation strategies develop
- Long-term vocal health risk
Practical Limitations
Despite utility, efficiency measurement has limitations.
Measurement Challenges
Technical Difficulties
Practical problems include:
- Invasive pressure measurement required for accuracy
- Acoustic power measurement complex
- Multiple instrumentation needed
- Expertise required
- Time-consuming protocol
- Expense of equipment
Clinical Feasibility
In routine practice:
- Full efficiency measurement rarely performed
- Proxy measures often used
- Aerodynamic measures more common than full efficiency
- Research setting more feasible
- Clinical estimation based on indirect indicators
- Simplified metrics more practical
Interpretation Ambiguities
What Does Efficiency Mean?
Complications include:
- High efficiency not always optimal (breathy soft voice may be appropriate)
- Low efficiency not always pathological (soft phonation naturally less efficient)
- Context matters (conversational vs. performance demands)
- Individual baseline important
- Multiple factors contribute
- Isolated metric insufficient
Alternative Efficiency Definitions
Various efficiency formulations have been proposed.
Source Efficiency vs. Radiation Efficiency
Distinguishing Components
Alternative breakdown:
- Source efficiency: glottal flow power to glottal sound power
- Radiation efficiency: glottal sound power to radiated sound power
- Transfer efficiency: vocal tract filtering effect
- Total efficiency: product of components
- Each reveals different aspects
- Multiple stages of energy conversion
Pressure-Based Efficiency
Alternative Input Definition
Using subglottal pressure energy:
- Acoustic power / (Pressure² × Time)
- Emphasizes pressure generation cost
- Less dependent on flow measurement
- Different normative values
- Complements standard definition
- Clinical utility unclear
Summary
Glottal efficiency quantifies the conversion of aerodynamic power (subglottal pressure × mean glottal airflow) into radiated acoustic power, calculated as their ratio and typically expressed as percentage, with normal voice production demonstrating remarkably low efficiency of 0.01-1% (mean conversational speech approximately 0.1%) reflecting that 95-99.99% of input energy is lost to viscous dissipation, tissue collision, and other non-radiative processes. Measurement requires simultaneous assessment of subglottal pressure (via tracheal puncture, esophageal catheter, or intraoral estimate), glottal airflow (pneumotachograph or inverse filtering), and acoustic power (calculated from sound pressure level at specified distance), with typical conversational values of 8 cm H₂O pressure, 150 ml/s flow, and 20 microwatt acoustic power yielding approximately 0.017% efficiency.
Glottal efficiency increases systematically with vocal intensity (soft phonation 0.01%, loud phonation 0.5-2%) because acoustic power increases faster than aerodynamic power due to stronger closure and better impedance matching, while exhibiting U-shaped frequency dependence with maximum efficiency at mid-range frequencies and reduced efficiency at low pitches (large amplitude) and high pitches (increased tension). Efficiency peaks at moderate adduction levels with both light adduction (incomplete closure, air leakage) and heavy adduction (excessive stiffness) reducing efficiency, and varies across registers with chest voice most efficient and falsetto least efficient due to incomplete closure.
Trained singers demonstrate 2-4 times higher efficiency than untrained speakers through optimal glottal configuration, improved coordination, and superior vocal tract tuning, while voice disorders systematically reduce efficiency with paralysis, mass lesions, atrophy, and scarring all showing efficiency decrements. Clinical applications include diagnostic assessment comparing to age/gender norms, therapy outcome monitoring with quantifiable improvement documentation, and biofeedback training using real-time efficiency display, though measurement challenges including invasive pressure measurement requirements and technical complexity limit routine clinical use in favor of proxy measures and indirect indicators.
Key Takeaways
- ✅ Glottal efficiency is ratio of acoustic power to aerodynamic power (pressure × flow), typically 0.01-1% (0.1% conversational)
- ✅ Remarkably low efficiency reflects 95-99.99% energy loss to viscous dissipation, collision, and non-radiative processes
- ✅ Efficiency increases with loudness (0.01% soft to 0.5-2% loud) due to stronger closure and better impedance matching
- ✅ U-shaped frequency dependence: maximum efficiency at mid-range, reduced at low (large amplitude) and high (tension) frequencies
- ✅ Peaks at moderate adduction; both light (incomplete closure) and heavy (excessive stiffness) adduction reduce efficiency
- ✅ Trained singers show 2-4x higher efficiency through optimal configuration, coordination, and vocal tract tuning
- ✅ Voice disorders systematically reduce efficiency; measurement aids diagnosis and documents treatment effectiveness
- ✅ Measurement challenges (invasive pressure assessment, technical complexity) limit routine clinical use despite theoretical value
Related Topics
- Power Losses
- Efficiency in a Multipurpose Machine
- Problems with Glottal Efficiency Definitions
- Phonation Threshold Pressure
- Glottal Source Power and Inverse Filtering
Further Reading
- Titze, I. R. (1992). Phonation threshold pressure: A missing link in glottal aerodynamics. Journal of the Acoustical Society of America, 91, 2926-2935.
- Isshiki, N. (1964). Regulatory mechanism of voice intensity variation. Journal of Speech and Hearing Research, 7, 17-29.
- Schutte, H. K. (1980). The Efficiency of Voice Production. Kemper.
- Holmberg, E. B., Hillman, R. E., & Perkell, J. S. (1989). Glottal airflow and transglottal air pressure measurements for male and female speakers in low, normal, and high pitch. Journal of Voice, 3(4), 294-305.
- Sundberg, J., Titze, I., & Scherer, R. (1993). Phonatory control in male singing: A study of the effects of subglottal pressure, fundamental frequency, and mode of phonation on the voice source. Journal of Voice, 7(1), 15-29.