Variation of Intensity with Adduction, Lung Pressure, and F₀
Vocal intensity can be regulated through two primary mechanisms operating at or below the level of the larynx: variation of lung pressure (subglottic pressure) and variation of glottal adduction. These mechanisms interact in complex ways with fundamental frequency to produce the wide range of vocal intensities required for communication and artistic expression.
Control Below the Larynx: Lung Pressure
Aerodynamic Power and Subglottic Pressure
The most straightforward mechanism for varying vocal intensity involves changing the aerodynamic power supplied to the vocal system by the respiratory system. Aerodynamic power (P_aero) is the product of lung pressure (P_sub) and mean airflow (U):
P_aero = P_sub × Uwhere:
- P_aero = aerodynamic power (watts)
- P_sub = subglottic pressure (Pa or cm H₂O)
- U = mean glottal airflow (m³/s or liters/s)
For a given glottal configuration, increasing lung pressure increases both the driving force for vocal fold oscillation and the volume of air flowing through the glottis per cycle, resulting in greater acoustic power output.
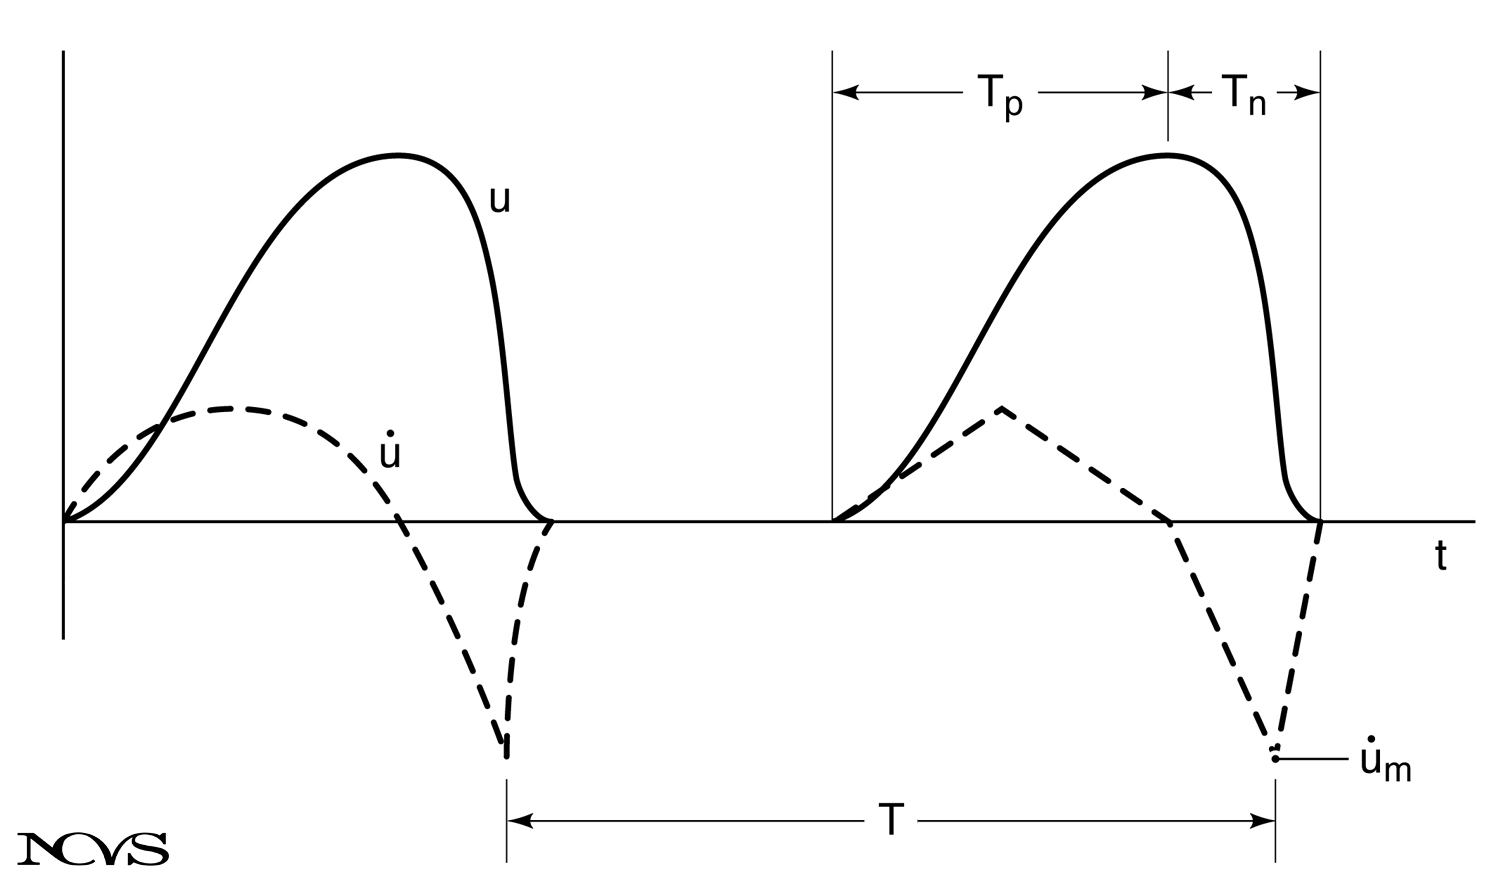 Figure 9.3: Schematic illustration showing how subglottic pressure influences glottal airflow and resulting acoustic power. Higher lung pressure produces greater flow, which translates to increased radiated intensity.
The 8–9 dB Rule
Empirical studies show that vocal intensity increases by roughly 8–9 dB for each doubling of lung pressure above phonation threshold, when other factors remain constant (Titze & Sundberg, 1992). Because the pressure that matters is the excess over phonation threshold pressure, the rule holds best when pressure is expressed as Pₛ − PTP, and it applies across a wide range of pressures and fundamental frequencies.
A pure pressure-squared law would predict 12 dB per doubling (four times the acoustic power). The observed 8–9 dB is smaller because glottal adduction, the shape of the flow pulse, and vocal tract loading all change as pressure rises. It nevertheless gives speakers an effective, nearly linear control of intensity in decibels.
Typical Pressure Ranges:
- Quiet speech: 3-5 cm H₂O (300-500 Pa)
- Conversational speech: 5-8 cm H₂O (500-800 Pa)
- Loud speech: 10-15 cm H₂O (1000-1500 Pa)
- Shouting: 20-30 cm H₂O (2000-3000 Pa)
- Maximum trained voice: up to 40-50 cm H₂O (4000-5000 Pa)
Phonation Threshold Pressure
Phonation threshold pressure (PTP) represents the minimum subglottic pressure required to initiate and sustain vocal fold oscillation. Below this threshold, the vocal folds remain stationary despite airflow through the glottis. At or above threshold, oscillation begins.
PTP depends on several factors:
Biomechanical Properties:
- Vocal fold stiffness (tension)
- Vocal fold thickness
- Degree of adduction
- Tissue viscosity
Frequency Dependency: PTP increases systematically with fundamental frequency. As pitch rises the folds become stiffer and thinner, so more driving pressure is needed to overcome viscous losses. Titze’s (1992) model gives approximately:
PTP ≈ 0.14 + 0.06 (F₀/F₀ₙ)² kPawhere F₀ₙ is the speaker’s normal (comfortable) speaking frequency. The threshold is therefore about 0.2 kPa (2 cm H₂O) near speaking pitch and rises quadratically above it—roughly 0.4 kPa at twice the speaking frequency. Measured values show the same upward trend, and the effect is strongest toward the top of the range.
Clinical Implications: Elevated PTP often indicates increased vocal fold stiffness due to:
- Vocal fold lesions (nodules, polyps, scarring)
- Muscle tension dysphonia
- Dehydration of vocal fold tissue
- Age-related tissue changes
Measuring PTP across the frequency range provides valuable information about vocal fold biomechanics and can track treatment progress.
Dynamic Range and Pressure Control
The dynamic range of vocal intensity at any given fundamental frequency extends from phonation threshold pressure to the maximum pressure a speaker can comfortably generate and sustain. This range typically spans 30-40 dB for untrained voices and can exceed 50 dB for trained singers.
Effective respiratory control enables:
- Sustained intensity: Maintaining constant pressure over long phrases
- Intensity modulation: Smoothly varying pressure for expressive dynamics
- Efficiency: Achieving required intensity with minimal effort
- Stamina: Prolonged phonation without fatigue
Control Within the Larynx: Glottal Adduction
The Role of Adduction in Intensity
While lung pressure provides the primary driving force for intensity variation, glottal adduction—the degree to which the vocal folds are brought together—plays a critical role in determining how efficiently aerodynamic power converts to acoustic power.
The adduction continuum ranges from:
- Breathy phonation: Incomplete closure, large glottal gap during closed phase
- Normal/modal phonation: Complete but gentle closure during closed phase
- Pressed phonation: Forceful compression, prolonged closed phase
Glottal Flow Waveform and Intensity
The shape of the glottal airflow waveform critically influences the spectral characteristics and overall intensity of the radiated sound. Two parameters particularly affect acoustic output:
Open Quotient (Q₀): The ratio of the time the glottis is open to the total period of oscillation:
Q₀ = T_open / T₀Research using computational models has shown that maximum acoustic power occurs at Q₀ values of approximately 0.5-0.6, slightly on the breathy side of normal phonation. This finding contradicts the intuition that pressed phonation (Q₀ < 0.4) would be most efficient.
At very low Q₀ (highly pressed), the vocal folds remain closed for so long that airflow becomes severely restricted, reducing total power despite increased pressure. At very high Q₀ (very breathy), incomplete closure allows continuous DC airflow that carries no acoustic information.
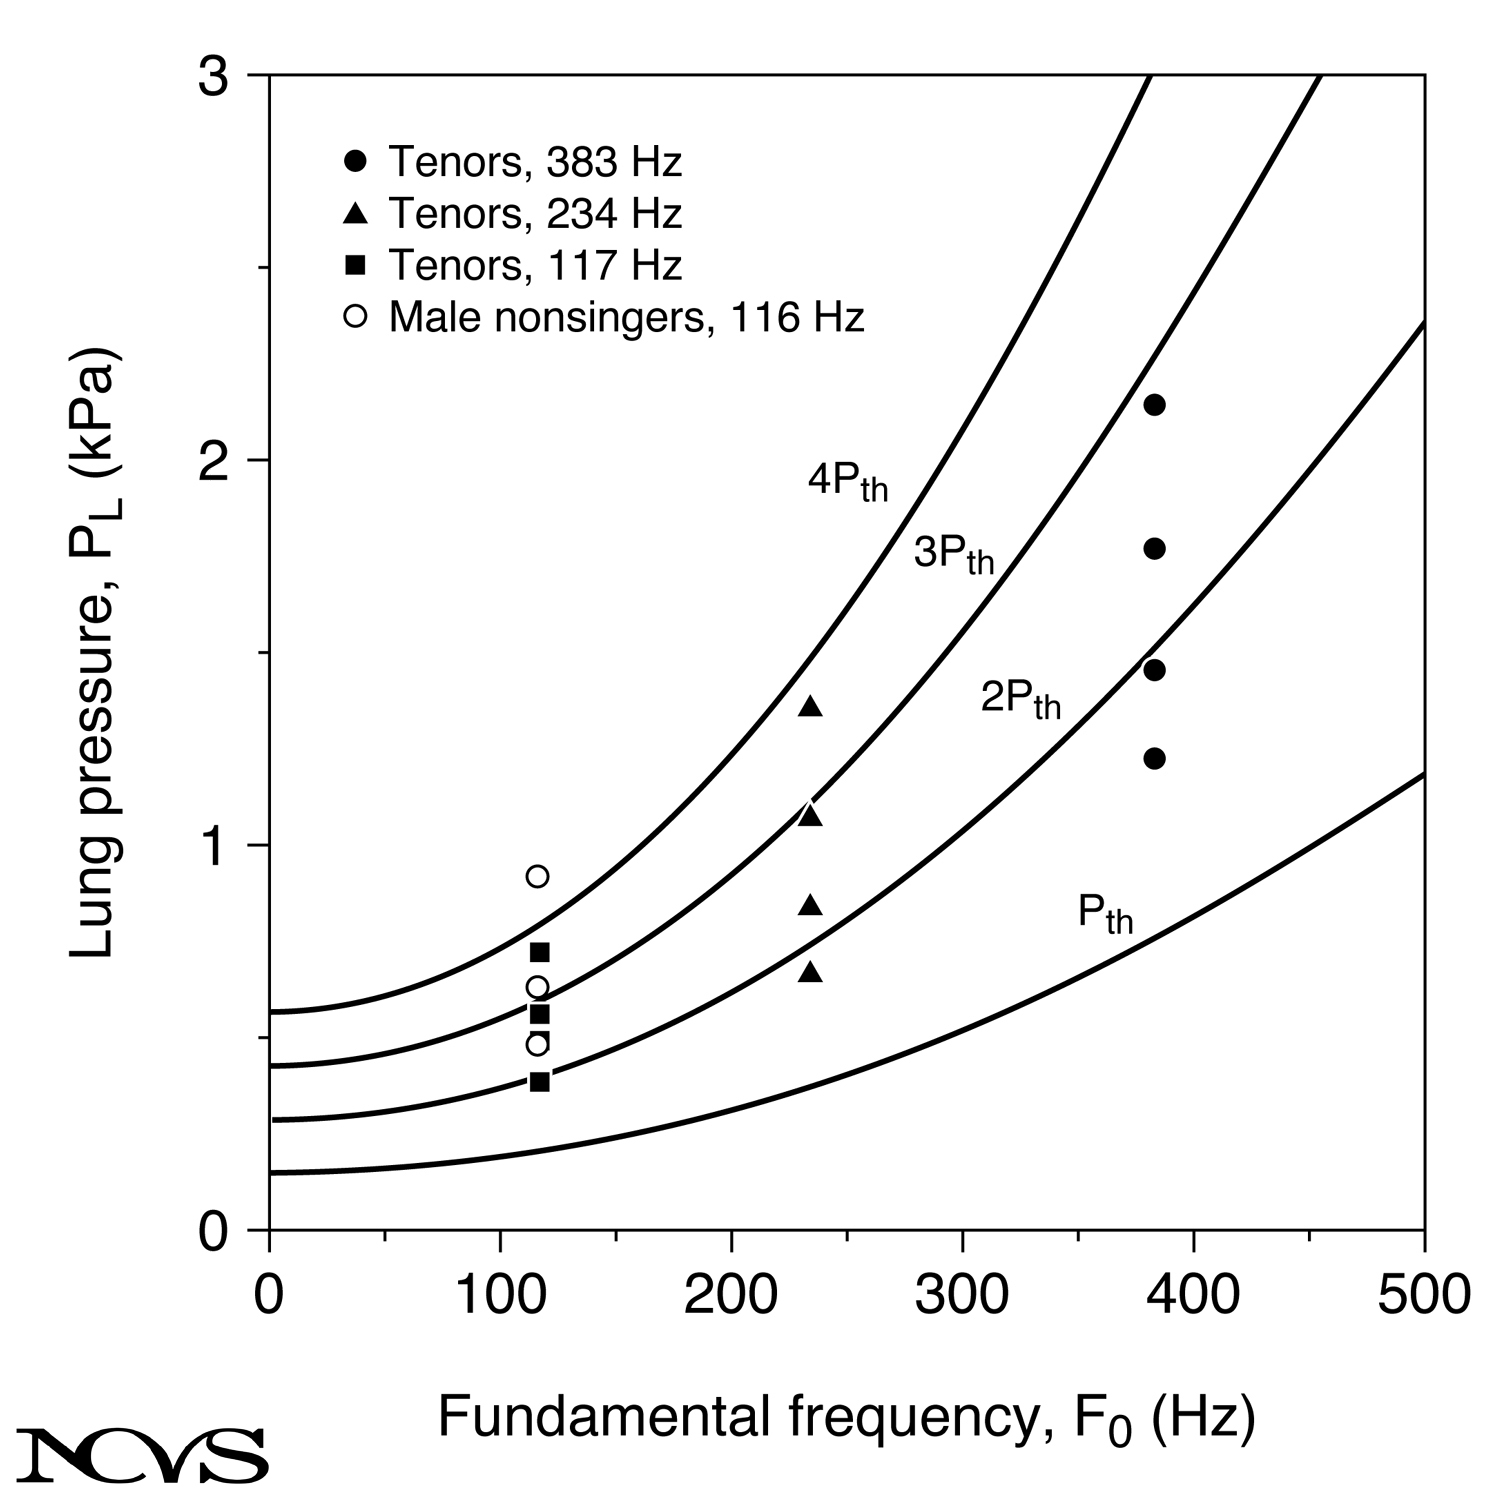 Figure 9.4: Variations in glottal flow waveform shape with different degrees of vocal fold adduction. The open quotient and maximum flow declination rate both influence acoustic power output.
Maximum Flow Declination Rate (MFDR): The steepness of glottal closure, represented by the maximum negative slope of the flow waveform:
MFDR = -dU/dt|maxA steeper closure (larger MFDR) produces:
- Stronger high-frequency harmonics
- Greater overall spectral energy
- Increased perceived intensity
- More “brilliant” or “ringing” voice quality
Pressed phonation typically exhibits steeper closures than breathy phonation, contributing to the association between pressed voice and perceived loudness, even when total acoustic power may not be maximized.
Inverse Filtering and Source Analysis
Inverse filtering techniques allow researchers to separate the effects of the glottal source from vocal tract resonances. By removing the vocal tract transfer function from the radiated sound, we can isolate the glottal volume velocity waveform and analyze its characteristics.
Studies using inverse filtering have revealed:
-
Individual Variation: Different speakers achieve similar intensities with different glottal strategies—some with steeper closures and lower flow, others with gentler closures and higher flow
-
Training Effects: Trained singers typically demonstrate more consistent glottal waveform shapes across intensity levels compared to untrained speakers
-
Efficiency Patterns: The most efficient glottal patterns (maximum acoustic output per unit aerodynamic power) occur with moderate adduction and Q₀ around 0.5-0.6
-
Spectral Shaping: Adduction changes not only total intensity but also spectral distribution, with pressed phonation favoring high frequencies
Interaction Between Intensity and F₀
The Intensity-Pitch Relationship
Vocal intensity and fundamental frequency interact in complex ways. Several factors link these two parameters:
Biomechanical Coupling: Increasing vocal fold tension to raise pitch also:
- Increases tissue stiffness
- Raises phonation threshold pressure
- Changes optimal aerodynamic-acoustic coupling
- Modifies the pressure-intensity relationship
Natural Co-variation: Most speakers naturally increase intensity when raising pitch, a phenomenon observed in:
- Emotional speech (excitement, anger)
- Questions versus statements
- Emphatic utterances
- Singing crescendos on ascending passages
This coupling appears partly involuntary, reflecting the biomechanical linkage between tension and oscillation amplitude.
 Figure 9.5: Voice range profile (phonetogram) showing intensity capabilities across fundamental frequency. The contours indicate minimum and maximum intensity at each F₀, revealing the expanded dynamic range in the middle frequency region.
The Voice Range Profile (Phonetogram)
The Voice Range Profile (VRP) or phonetogram maps an individual’s intensity capabilities across their full frequency range. This two-dimensional representation plots:
- X-axis: Fundamental frequency (Hz or semitones)
- Y-axis: Sound pressure level (dB SPL at standard distance)
Typical VRP characteristics:
Shape Features:
- Maximum dynamic range occurs in the middle of the frequency range
- Range narrows at frequency extremes (both low and high)
- Upper contour rises slightly with frequency
- Lower contour (softest phonation) rises more steeply with frequency
Clinical Value:
- Documents functional vocal capabilities
- Reveals limitations imposed by pathology
- Tracks progress in voice therapy or training
- Distinguishes trained from untrained voices
- Identifies optimal performance regions
Training Effects: Professional singers demonstrate:
- Wider frequency range (extended highs and lows)
- Greater dynamic range (up to 60 dB at optimal frequencies)
- More uniform capability across frequency range
- Ability to produce soft phonation at high pitches (difficult for untrained voices)
Strategies for Intensity Control Across Pitch
Effective intensity management requires coordinated adjustment of multiple parameters:
Ascending Pitch with Constant Intensity:
- Gradually decrease adduction to compensate for rising PTP
- Minimize pressure increase (rely on frequency rise for some intensity gain)
- Maintain consistent flow through subtle glottal adjustments
Descending Pitch with Constant Intensity:
- Increase adduction to maintain efficiency as tension decreases
- May require slight pressure increase at lowest frequencies
- Monitor for excessive pressing at low pitches
Intensity Variation at Constant Pitch:
- Primary mechanism: Lung pressure variation
- Secondary adjustment: Fine-tune adduction for optimal efficiency
- Avoid excessive adduction changes that alter voice quality
Practical Applications
Clinical Assessment
Understanding pressure-adduction-frequency interactions enables clinicians to:
Diagnose Dysfunction:
- Excessive pressure for achieved intensity suggests inefficient glottal closure
- Limited dynamic range may indicate restricted adduction capability
- Inability to sustain intensity suggests respiratory or glottal weakness
Guide Therapy:
- Teaching optimal pressure levels for various speaking contexts
- Developing coordinated respiratory-laryngeal control
- Balancing pressure and adduction to minimize vocal trauma
Vocal Pedagogy
Voice teachers apply these principles when:
Building Technical Skill:
- Developing independent control of pressure, pitch, and quality
- Establishing efficient coordination patterns
- Expanding dynamic range throughout the frequency range
Repertoire Application:
- Selecting appropriate strategies for different musical styles
- Managing sustained high-intensity passages
- Executing dynamic contrasts while maintaining vocal health
Professional Voice Use
Professional voice users benefit from understanding:
Vocal Economy:
- Achieving required intensity with minimum physiological cost
- Choosing respiratory versus laryngeal strategies appropriately
- Recognizing and avoiding harmful hyperfunctional patterns
Environmental Adaptation:
- Adjusting to different acoustic spaces
- Compensating for background noise
- Projecting voice without excessive effort
Summary
Vocal intensity is controlled through coordinated adjustments of lung pressure and glottal adduction, with both mechanisms interacting in complex ways with fundamental frequency. Lung pressure provides the primary control variable, with intensity increasing roughly 8–9 dB per doubling of lung pressure above threshold. Phonation threshold pressure increases with frequency, requiring greater driving pressures at higher pitches.
Glottal adduction affects how efficiently aerodynamic power converts to acoustic power, with optimal acoustic output occurring at moderate adduction levels (Q₀ = 0.5-0.6). The relationship between intensity and fundamental frequency is documented in the Voice Range Profile, which reveals maximum dynamic range in the middle frequency region and progressive limitations at frequency extremes.
Effective intensity control requires sophisticated coordination of respiratory and laryngeal systems, with different strategies appropriate for different communicative and artistic contexts. Understanding these mechanisms enables more effective clinical intervention, more informed pedagogical guidance, and more efficient professional voice use.
Key Takeaways
- ✅ Vocal intensity increases by roughly 8–9 dB for each doubling of lung pressure above phonation threshold
- ✅ Phonation threshold pressure rises with fundamental frequency, roughly quadratically above the speaking range (PTP ≈ 0.14 + 0.06 (F₀/F₀ₙ)² kPa)
- ✅ Maximum acoustic power occurs at open quotients of 0.5-0.6, not with maximally pressed phonation
- ✅ Maximum flow declination rate (steepness of glottal closure) strongly influences spectral energy distribution
- ✅ The Voice Range Profile documents intensity capabilities across frequency, showing maximum dynamic range in the middle frequency region
- ✅ Effective intensity control requires coordinated adjustment of lung pressure, glottal adduction, and fundamental frequency
- ✅ Trained voices demonstrate greater dynamic range, wider frequency range, and more consistent efficiency across conditions
Related Topics
- Some Definitions of Terms
- Radiation of Sound
- Vocal Efficiency
- Myoelastic-Aerodynamic Theory
- Respiratory System
Further Reading
- Titze, I. R. (1992). Phonation threshold pressure: A missing link in glottal aerodynamics. Journal of the Acoustical Society of America, 91(5), 2926-2935.
- Holmberg, E. B., Hillman, R. E., & Perkell, J. S. (1988). Glottal airflow and transglottal air pressure measurements for male and female speakers in soft, normal, and loud voice. Journal of the Acoustical Society of America, 84(2), 511-529.
- Sundberg, J., Titze, I. R., & Scherer, R. (1993). Phonatory control in male singing: A study of the effects of subglottal pressure, fundamental frequency, and mode of phonation on the voice source. Journal of Voice, 7(1), 15-29.
- Gramming, P., Sundberg, J., Ternström, S., Leanderson, R., & Perkins, W. H. (1988). Relationship between changes in voice pitch and loudness. Journal of Voice, 2(2), 118-126.